Ramco System Ltd.
IT Consulting & Software
FV – Rs 10; 52wks H/L – 219.5/64.1; TTQ – 1.09 Lacs; CMP – Rs 222.2 (As On Aug 21, 2020);
Market Cap – Rs 586 Crs
Consolidated Financials and Valuations (Amt in Rs Crs unless specified)
| Ramco System | ||||||||||
| Year | Equity Capital | Net Worth | Long Term Debt | Total Sales | PAT | BV | EPS | P/E | P/BV | Promoter’s Holdings |
| Rs Cr. | Rs Cr. | Rs Cr. | Rs Cr. | Rs Cr. | Rs | Rs | % | |||
| 2020-21 (Q1) | 31 | 620 | 93 | 145 | 14 | 202.35 | 4.63 | 48.00 | 1.10 | 50.03 |
| 2019-20 | 31 | 606 | 93 | 569 | 11 | 197.73 | 3.56 | 62.36 | 1.12 | 50.05 |
About the Company:
Ramco Systems is part of the Ramco Group of companies. Started as an R&D division of Ramco Industries Limited in 1992, Ramco Systems was later established as an independent company in 1997. It’s headquarters are in Chennai and the company has 24 offices spread across India, USA, Canada, Europe, Australia, Middle East, South Africa and APAC. The company focuses on providing innovative business solutions that can be delivered quickly and cost-effectively in complex environments.
Ramco is a fast growing enterprise software player disrupting the market with its multi-tenanted cloud and mobile-based enterprise software in the area of HCM and Global Payroll, ERP and M&E MRO for Aviation. Ramco Systems focuses on Innovation and Culture to differentiate itself in the marketplace.
Their segmental revenue breakup is as follows:
- Americas – 22%
- Europe – 2%
- APAC – 41%
- India – 21%
- MEA – 14%
Board of Directors:
- Shri P R Venketrama Raja: Chairman
- Shri P V Abinav Ramasubramaniam Raja: Whole-Time Director
- Virender Aggarwal: Chief Executive Officer
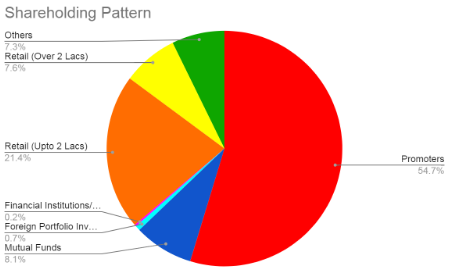
Shareholding Pattern:

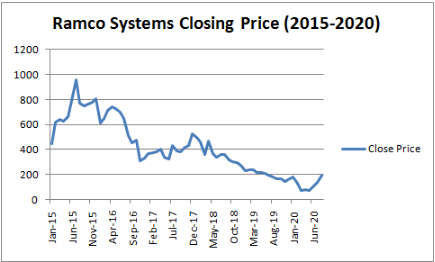
Price History:

Peer Comparison:
All figures in Rs Cr. Unless Specified
|
2020 |
Ramco Systems | Tata Elxsi | Aurion Pro | Newgen Software |
| Price (Rs) | 191.35 | 1020.05 | 60.1 | 179.1 |
| FV (Rs) | 10 | 10 | 10 | 10 |
| Market Cap | 586 | 6353 | 137 | 1253 |
| Equity | 31 | 62 | 73 | 69 |
| Net Worth | 606 | 1090 | 543 | 549 |
| Total Debt | 93 | 13 | 95 | 75 |
| Sales | 569 | 1610 | 455 | 661 |
| Net Profit | 11 | 256 | 66 | 41 |
| EPS (Rs) | 3.6 | 41.1 | 9.1 | 6.0 |
| BV (Rs) | 197.7 | 175.0 | 74.7 | 79.5 |
| PE | 53.70 | 24.80 | 6.63 | 29.84 |
| PB | 0.97 | 5.83 | 0.80 | 2.25 |
