India Cements
Cements & Cement Products
FV – Rs 10; 52wks H/L – 140/67.9; TTQ – 3.93 Lacs; C MP – Rs 131.7 (As On May 8, 2020); Market Cap – Rs 4081 Crs
Consolidated Financials and Valuations (Amt in Rs Crs unless specified)
| India Cement | ||||||||||
| Year | Equity Capital | Net Worth | Long Term Debt | Total Sales | PAT | BV | EPS | P/E | P/BV | Promoter’s Holdings |
| Rs Cr. | Rs Cr. | Rs Cr. | Rs Cr. | Rs Cr. | Rs | Rs | % | |||
| 2019/20
(9 Months) |
310 | 5284 | 3125 | 4030 | 65 | 170.50 | 2.10 | 62.58 | 0.77 | 28.26 |
| 2018/19 | 310 | 5246 | 3048 | 5809 | 25 | 169.28 | 0.82 | 161.57 | 0.78 | 28.30 |
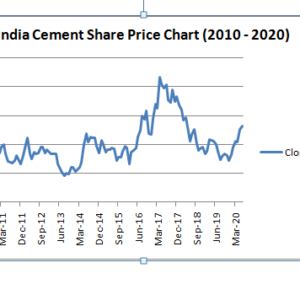
Price Chart (2010-2020):

Peer Comparison:
| India Cement (9mo) | Ultratech Cements | Shree Cements | Birla Corporation | |
| Price (Rs) | 131.7 | 3779.75 | 21190.45 | 538.95 |
| FV (Rs) | 10 | 10 | 10 | 10 |
| Market Cap | 4081 | 109093 | 76457 | 4150 |
| Equity | 310 | 289 | 36 | 77 |
| Net Worth | 5349 | 39115 | 13169 | 4806 |
| Total Debt | 3125 | 21353 | 2349 | 3753 |
| Sales | 4030 | 42773 | 13143 | 7001 |
| Net Profit | 65 | 5810 | 1544 | 505 |
| EPS (Rs) | 2.1 | 201.3 | 428.0 | 65.6 |
| BV (Rs) | 172.6 | 1355.2 | 3650.1 | 624.1 |
| PE | 47.1 | 18.8 | 49.5 | 8.2 |
| PB | 0.8 | 2.8 | 5.8 | 0.9 |
| Capacity (MT) | 15.5 | 111.4 | 40.4 | 15.5 |
| Realization Per Tonne | 3650 | 4750 | 4648 | 4712 |
