L&T Infotech
IT Consulting and Software
FV – Rs 1; 52wks H/L – 2049.4/1207.6; TTQ – 2469 Lacs; CMP – Rs 1856.4 (As On May 7, 2020); Market Cap – Rs 32335.28 Crs
Consolidated Financials and Valuations (Amt in Rs Crs unless specified)
| L&T Infotech | ||||||||||
| Year | Equity Capital | Net Worth | Long Term Debt | Total Sales | PAT | BV | EPS | P/E | P/BV | Promoter’s Holdings |
| Rs Cr. | Rs Cr. | Rs Cr. | Rs Cr. | Rs Cr. | Rs | Rs | % | |||
| 2019 | 17 | 5404 | 0 | 11208 | 1521 | 310.57 | 87.39 | 21.24 | 5.98 | 74.53 |
| 2018 | 17 | 4894 | 32 | 9748 | 1516 | 281.25 | 87.10 | 21.31 | 6.60 | 74.80 |
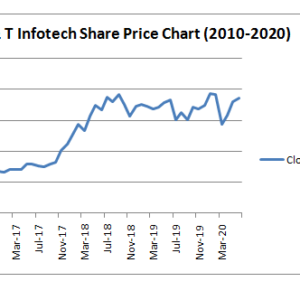
Price Chart (2010-2020) :

Peer Comparison :
All figures are in Rs Cr. unless specified.
| LT Infotech | HCL Tech | NIIT Tech | Oracle | |
| Price (Rs) | 1856.4 | 575.9 | 1469.1 | 2541.9 |
| FV (Rs) | 1 | 2 | 10 | 5 |
| Market Cap | 32335 | 156280 | 9181 | 21849 |
| Equity | 17 | 543 | 63 | 43 |
| Net Worth | 5404 | 51267 | 2397 | 6570 |
| Total Debt | 0 | 4693 | 21 | 0 |
| Sales | 11208 | 71265 | 4252 | 5039 |
| Net Profit | 1521 | 11057 | 468 | 1462 |
| EPS (Rs) | 89.5 | 40.7 | 74.8 | 170.3 |
| BV (Rs) | 317.9 | 188.8 | 383.4 | 765.0 |
| PE | 20.7 | 14.1 | 19.6 | 14.9 |
| PB | 5.8 | 3.0 | 3.8 | 3.3 |
