Bharat Financial Inclusion Ltd
Finance (Including NBFCs)
FV – Rs 10; 52wks H/L –938.75/435; TTQ – 5.24 Lacs; CMP – Rs 612 (As On December 30th 2016);
Market Cap – Rs 8441 Crs
Standalone Financials and Valuations for FY16 (Amt in Rs Crs unless specified)
Equity Capital |
Net worth |
Long Term Debt | Total Sales |
PAT | BV (Rs) |
EPS (Rs) |
P/E |
Industry P/E |
P/BV |
Promoter’s Stake |
Beta |
| 127.31 | 1383 | 2269 | 1321 | 302.98 | 109 | 23.8 | 25.71 | 48.66 | 5.61 | 1.75 | 1.84 |
Standalone Financials and Valuations for H1 FY17
Equity Capital |
Net worth |
Long Term Debt | Total Sales |
PAT | BV (Rs) |
EPS (Rs) |
P/E |
Industry P/E |
P/BV |
Promoter’s Stake |
Beta |
| 137.55 | 2513 | 2109 | 776 | 381.79 | 183 | 27.76 | 22.05 | 48.66 | 3.34 | 1.75 | 1.84 |
Valuation Parameters:
- Long Term Debt to Equity – 1.64
- ROE % – 22
- Market Cap/Sales – 6.4
The company has a Gross Loan Portfolio of Rs. 9046 Crs as on Q2 FY17.
Morgan Stanley Asia (Singapore) and Morgan Stanley Mauritius Company acquired 1.0996 per cent stake Bharat Financial, according to the release on23rdDecember,2016. http://economictimes.indiatimes.com/markets/stocks/news/bharat-financial-surges-over-10-on-stake-hike-by-morgan-stanley-units/articleshow/56214855.cms
Overview:
- Bharat Financial Inclusion Limited, formerly SKS Microfinance Limited, is a non-banking financial company-micro finance institution (NBFC-MFI).
- The core business of the Company is providing small value unsecured loans and certain other basic financial services to its Members (Individuals from low income households who are clients of the Company are classified as “Members” and Members whose loans are outstanding are classified as “Borrowers”).
- The Company is engaged in providing micro finance services to women in the rural areas of India enrolled as members and organized as Joint Liability Groups.
- In addition to its business of providing micro-credit, the Company uses its distribution channel to provide other financial products and services to the members.
- Programs in this regard primarily relate to providing of loans to the members for the purchase of mobile handsets, solar lamps, bicycle and sewing machines, among others.
- The Company provides door step delivery of its services through center meetings in villages.
- The Company offers loans mainly for income generating activities and not for personal consumption.
- The Company has presence across approximately 20 states, covering over 100,000 villages and catering to approximately 69.7 lakh women members.
- The Capital Adequacy Ratio is 33.4%
Management:
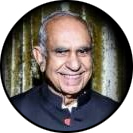
- M. R. Rao – MD & CEO
The Equity Capital is @ Rs 137.55 Crs consisting of 137551594 equity Shares of FV Rs 10 currently held as under

None Of the Promoter’s Holding is pledged.
Major Non – Promoter Holdings:
| Sr.No | Non – Promoters | No. of shares held | % of shares held |
| 1 | IDFC | 3278728 | 2.38 |
| 2 | BIRLA SUN LIFE TRUSTEE COMPANY PRIVATE LIMITED | 1998458 | 1.45 |
| 3 | CITIGROUP GLOBAL MARKETS MAURITIUS PRIVATE LIMITED | 1388334 | 1.01 |
| 4 | MORGAN STANLEY INDIA INVESTMENT FUND, INC. | 1483299 | 1.08 |
| 5 | KUWAIT INVESTMENT AUTHORITY – FUND NO. 208 | 1539368 | 1.12 |
| 6 | SWISS FINANCE CORPORATION (MAURITIUS) LIMITED | 1623436 | 1.18 |
| 7 | AMUNDI FUNDS EQUITY INDIA | 1850000 | 1.34 |
| 8 | PINEBRIDGE INVESTMENTS GF MAURITIUS LIMITED | 1918983 | 1.4 |
| 9 | TIAA-CREF FUNDS – TIAA CREF INTERNATIONAL EQUITY F | 4409111 | 3.21 |
| 10 | MORGAN STANLEY MAURITIUS COMPANY LIMITED | 5240577 | 3.81 |
| 11 | AMANSA HOLDINGS PRIVATE LIMITED | 5400000 | 3.93 |
| 12 | GOLDMAN SACHS (SINGAPORE) PTE | 2007900 | 1.46 |
| 13 | TREE LINE ASIA MASTER FUND (SINGAPORE) PTE LTD | 2357076 | 1.71 |
| 14 | MORGAN STANLEY ASIA (SINGAPORE) PTE. | 3283935 | 2.39 |
| 15 | CREDIT SUISSE (SINGAPORE) LIMITED | 3285764 | 2.39 |
| 16 | INDUS INDIA FUND (MAURITIUS) LIMITED | 3716632 | 2.7 |
| 17 | BARON EMERGING MARKETS FUND | 3772097 | 2.74 |
| 18 | SMALL INDUSTRIES DEVELOPMENT BANK OF INDIA | 1471961 | 1.07 |
| 19 | SANDSTONE INVESTMENT PARTNERS I | 2347117 | 1.71 |
| 20 | KISMET SKS II | 1943940 | 1.41 |
| 21 | TREE LINE ASIA MASTER FUND (SINGAPORE) PTE LTD | 1492924 | 1.09 |
| 22 | VINOD KHOSLA | 3419241 | 2.49 |

Standalone Financial Trends (In Rs. Crs) :
| Particulars | FY16 | FY15 | FY14 | FY13 | FY12 | FY11 |
| Equity Paid Up | 127.31 | 126.29 | 108.21 | 108.21 | 72.36 | 72.36 |
| Networth | 1383 | 1046 | 459 | 390 | 430 | 1781 |
| Total Debt | 2913 | 1667 | 632 | 837 | 416 | 1081 |
| Net Sales | 1321 | 803 | 545 | 353 | 472 | 1270 |
| Other Income | 152 | 79 | 26 | 20 | 37 | 94 |
| PAT | 302.98 | 187.66 | 69.85 | -297.14 | -1360.6 | 111.63 |
| Book Value (Rs) | 109 | 83 | 42 | 36 | 59 | 246 |
| EPS (Rs) | 23.80 | 14.86 | 6.46 | -27.46 | -188.03 | 15.43 |


