UNION BUDGET 2020 S(LAYING) THE ECONOMIC FOUNDATION
Disconnect | Deficit | Debt | Disinvestment | Dividend | Dispute
deduce ~ reach a conclusion by thinking about the information or evidence that is available
deconstruct ~ reduce something to it’s basic elements in order to interpret it in a different way
Here’s the flow of how we have deconstructed and deduced the Union Budget 2020 for you with a focus on the ‘D’s as above offering you a perspective on each supported by government statistics on record .This a Three Part Scrip Standpoint , each of which is being send separately to reinforce the content
PART I ~ DISCONNECT ~Declining Economic Growth vs Rising Record Sensex
PART II ~ DEFICIT AND DEBT ~ Dancing with Deficit and are Sovereign Bonds the Solution? PART III ~ DISINVESTMENT ~ (Dis)Comfort with Complacency of a High LIC Valuation
DIVIDEND DISTRIBUTION TAX ~ Reverting to taxing the Recipient
DISPUTE ~ Vivad se Vishwas Scheme ~ One Time Offer for resolving Direct Tax Disputes
MACROECONOMIC BACKDROP | SPEECH | BUDGET AT A GLANCE
Is the Union Budget a Non Event ?
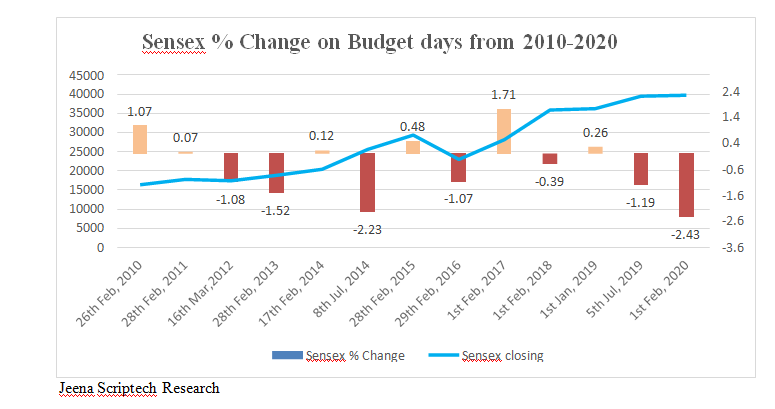
The Sensex may react on the Budget Day as graphically shown below ,but going forward shrugs off this event sentiment and moves on, making the Budget more a Non Event

On Saturday, February 1,2020 we heard the longest ever Union Budget Speech by a Finance Minister when Mrs Nirmala Sitharaman addressed the Parliament from 11 am to pm and feeling exhausted wound up taking the last two pages as read .In her Interim Budget Speech on July 5,2019 there was mention of India becoming a US $ 5 Trillion Economy by 2024/25 and that in the ongoing year itself the GDP would be US $ 3 Trillion.Her Speech on February 1,2020 had no mention of this again .On Saturday, February 1,2020 we heard the longest ever Union Budget Speech by a Finance Minister when Mrs Nirmala Sitharaman addressed the Parliament from 11 am to
The Reason has to be the stark decline in the GDP Growth Rate in the past few quarters and it is concerning that the nominal rate (Real + Inflation) for this ongoing year is just 7.5% from the 12% assumed in the first Budget Estimates last year.
The FM had a tough job balancing the Budget against a Backdrop of declining GDP growth, rising Unemployment and declining Tax Revenues .There is an imperative need to stimulate both the Drivers of our Economy, Investment in Infrastructure and Consumption. Pre Budget, the Government had addressed the first Driver to stimulate Growth by
- Sacrificing Annual Corporate Tax Revenues to an extent of Rs 1,45,000 crs by slashing the Corporate Tax Rate ~ more on this in PART II
- Announcing the National Infrastructure Pipeline of Rs 103 lakh Crs or US $ 1.4 Trillion over five years
The First was a Promise made in 2014 ,but in our View ,given the worrying state of our Economy, it could have been deferred for at least another two years. The Second ,may look ambitious ,but is a much needed thrust though raising concerns of funding as the outlay of US $ 1.4 Trillion equals our current Total Government Debt .The Government focus is on raising Sovereign Debt which in turn, in our view raises even more concern which we have highlighted in PART II
Macroeconomic Backdrop
Declining Economic Growth | Growing Unemployment | Rising Sensex
| Date of Budget
(Pre Budget Date Figures) |
Unit |
10/7/14 |
28/2/15 |
29/2/16 |
1/2/17 |
1/2/18 |
Interim 1 1/2/19 | Interim 2 5/7/19 |
1/2/20 |
| Financial Year | 2014/15 | 2015/16 | 2016/17 | 2017/18 | 2018/19 | 2019/20 | 2019/20 | 2019/20 | |
| GDP | Rs Crs | 12488000 | 13567192 | 15075429 | 16784679 | 18840731 | 21100607 | 21007439 | 20442233 |
| GDP Growth Rate | % | 7.2 | 8.6 | 11.1 | 11.3 | 13.3 | 12 | 10.5 | 7.5 |
| Unemployment Rate | % | 4.9 | 5 | 8.7 | 4.7 | 5.5 | 6.9 | 7.5 | 7.3 |
| Fiscal Deficit/ GDP | % | 4.1 | 3.9 | 3.5 | 3.5 | 3.4 | 3.3 | 3.4 | 3.8 |
| Sensex | Level | 25445 | 29220 | 23154 | 28743 | 34184 | 35867 | 39908 | 40723 |
| Sensex Growth yoy | % | 34.9 | 14.8 | -20.8 | 24.1 | 18.9 | 4.9 | 11.3 | 13.5 |
| Repo Rate | % | 8 | 7.75 | 6.75 | 6.25 | 6 | 6.5 | 5.75 | 5.15 |
| Exchange Rate | Rs/$ | 59.9 | 61.8 | 68.6 | 67.6 | 63.6 | 71.1 | 68.7 | 71.5 |
| Inflation Rate | % | 5.9 | 4.9 | 4.5 | 3.6 | 3.4 | 3.4 | 3 | 4.1/7.3 |
| Forex Reserves | $ Bn | 316 | 334 | 350 | 362 | 418 | 398 | 428 | 467 |
| Oil Price | $/barrel | 102.3 | 49.8 | 33.8 | 52.8 | 64.7 | 53.8 | 56.8 | 51.6 |
| Gold | Rs/10g | 28490 | 26477 | 29495 | 28823 | 30451 | 33305 | 34592 | 41230 |
Source : RBI,BSE,NSE,CMIE,Budget Documents,Jeena Scriptech Research
The Current Unemployment Rate is 7.3% .The graph below reveals a concern of a much higher Unemployment Rate (UER) in the Youth despite higher labour participation (LPR)

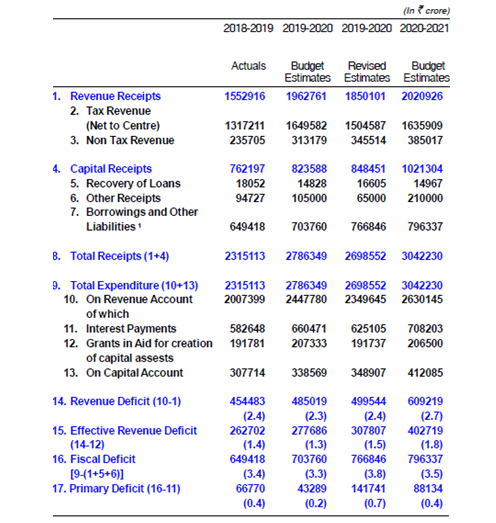
Union Budget 2020 at a Glance

Budget Estimate of GDP for 2020-2021 has been projected at Rs 2,24,89,420 crs assuming
a 10 % growth over the revised estimated GDP of Rs 2,04,42,233 crs for 2019-2020
PART I
DISCONNECT ~ Declining Economic Growth vs Rising Record Sensex
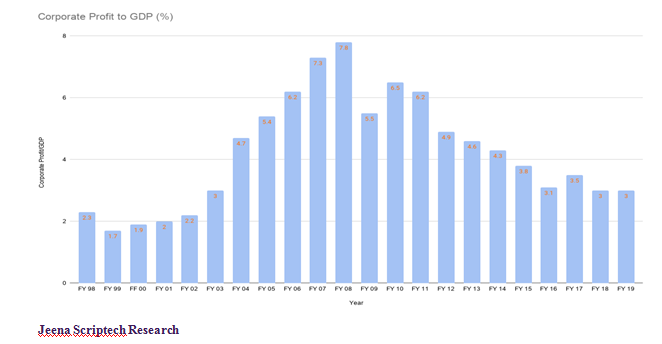
Here’s the clear Disconnect between the declining economic growth, Corporate Earnings/GDP and the rising Sensex
|
Date of Budget |
Unit |
10/7/2014 |
28/2/15 |
29/2/16 |
1/2/2017 |
1/2/2018 |
Interim 1
1/2/2019 |
Interim 2
5/7/2019 |
1/2/2020 |
| Financial Year | 2014/15 | 2015/16 | 2016/17 | 2017/18 | 2018/19 | 2019/20 | 2019/20 | 2019/20 | |
| GDP Growth Rate | % | 7.2 | 8.6 | 11.1 | 11.3 | 13.3 | 12 | 10.5 | 7.5 |
| Sensex Before Budget | 25445 | 29220 | 23154 | 28743 | 34184 | 35867 | 39908 | 40723 | |
| Sensex Growth yoy | % | 34.9 | 14.8 | -20.8 | 24.1 | 18.9 | 4.9 | 11.3 | 13.5 |
Jeena Scriptech Research

Why this Disconnect ?
Think of Equity as a Table with four Legs being Valuation, Liquidity, Momentum and Sentiment
Despite an alarming decline in the GDP Growth Rates and the Corporate Earnings/GDP Rate as above, the Sensex has risen significantly.
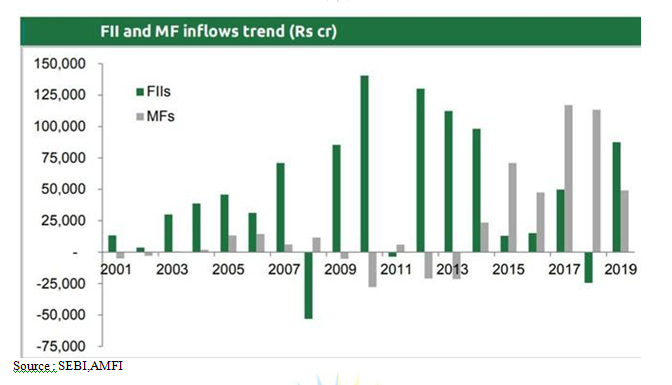
Stock Markets Legs of Momentum and Sentiment have been driven up by the Leg of High Liquidity Inflows from Foreign Portfolio Investment (FPI/FII) and Domestic Mutual Funds (MF) as Statistics below demonstrate.

The High Mutual Fund Inflows into Indian Equity in the years 2017 to 2019 can be attributed as an outcome of Demonetisation in November 2016
| FPI Investments – Financial Year | |||||||
|
Financial Year |
In Rs Crs | ||||||
| Debt-VRR | Hybrid | Total | |||||
| Equity | Debt | ||||||
| 2014-15 | 111333 | 0 | 0 | 277461 | |||
| 166127 | |||||||
| 2015-16 | -14172 | -4004 | 0 | 0 | -18176 | ||
| 2016-17 | 55703 | -7292 | 0 | 0 | 48411 | ||
| 2017-18 | 25635 | 119036 | 0 | 11 | 144682 | ||
| 2018-19 | -88 | -42357 | 0 | 3515 | -38930 | ||
| 2019-20 | 65234 | 7995 | 2677 | 5301 | 78530 | ||
| Total | 951735 | 379912 | 2677 | 8827 | 1340471 | ||
| FPI Net Investments in 2019 and 2020 up to February 6,2020 | |||||
|
Calendar Year |
In Rs Crs | ||||
| Equity | Debt | Debt-VRR | Hybrid | Total | |
| 2019 | 101122 | 25882 | – | 8995 | 135995 |
| 2020 | 11051 | -13222 | 2677 | -46 | 460 |
Source : NSDL
US $ 14 Billion have been pumped by FPIs into Indian Equity in 2019 and in just over a month in 2020 the FPI Inflow has crossed US $ 1.5 Billion
When have we had before, in a Financial Year in this Millenium ,where on a declining GDP Growth Rate,the Sensex has significantly risen ?
|
Year |
GDP
growth % |
Change in GDP
% |
Change in Sensex % |
FPI Equity Inflows US $ Billion |
| 1999-2000 | 8.8 | |||
| 2000-2001 | 3.8 | -5.0 | -23.8 | 1.4 |
| 2001-2002 | 4.8 | 1 | -18.3 | 1.1 |
| 2003-2003 | 3.8 | -1.02 | 3.5 | 0.4 |
| 2003-2004 | 7.9 | 4.1 | 72.6 | 5.6 |
| 2004-2005 | 7.9 | – | 12.4 | 6.1 |
| 2005-2006 | 7.9 | – | 41.8 | 6.8 |
| 2006-2007 | 8.1 | 0.2 | 46.3 | 3.5 |
| 2007-2008 | 7.7 | -0.4 | 46.7 | 7.4 |
| 2008-2009 | 3.1 | -4.6 | -52.5 | -6.6 |
| 2009-2010 | 7.9 | 4.8 | 79.7 | 15.3 |
| 2010-2011 | 7.5 | -0.4 | 17.4 | 15.3 |
| 2011-2012 | 5.2 | -2.3 | -25.1 | 6.1 |
| 2012-2013 | 5.5 | 0.3 | 25.1 | 19.5 |
| 2013-2014 | 6.4 | 0.9 | 8.5 | 11.1 |
| 2014-2015 | 7.4 | 1 | 29.6 | 15.5 |
| 2015-2016 | 8 | 0.6 | -5 | -2 |
| 2016-2017 | 8.2 | 0.2 | 2 | 7.7 |
| 2017-2018 | 7.2 | -1 | 27.5 | 3.6 |
| 2018-2019 | 6.8 | -0.4 | 5.9 | negligible |
| 2019-2020 | 4.8 | -2 | 14.08 | 7.3 |
Jeena Scriptech Research
The Table highlights a clear disconnect in the past three financial years from 2017-18
In our view, at 4.8% GDP Real Growth in FY 20, we are at a low base and perhaps may see a marginal decline for the next two or three quarters before we once again rebound and resume a sustainable upward momentum in the coming years
Our GDP will surely reach US $ Five Trillion, albeit not by the targeted FY 25 , and with a prayer that the Rupee remains stable .Any significant weakening of the Rupee will take this target even further away
One thing to keep in mind is that rising Inflation restricts RBI’s ability to further reduce the repo rate in an endeavour to stimulate the economy
Disclosure & Disclaimer
This Report is under our free access SCRIP STANDPOINT Module.It is for the personal information of the recipient/reader.We we are not soliciting any action based upon it. This report is not to be construed as an offer to sell or the solicitation of an offer to buy any security in any jurisdiction. It is our Viewpoint for general information purposes only.It does not take into account the particular investment objectives, financial situations, or needs of individuals & other entities .We have reviewed the report, and in so far as it includes current or historical information, it is believed to be reliable though its accuracy or completeness cannot be guaranteed. Neither JSAAPL, nor any person connected with it, accepts any liability arising from the use of this document. The recipients of this material should rely on their own investigations and take their own professional advice. Opinions expressed are our current opinions as of the date appearing on this material only.No part of this material may be duplicated in any form and/or redistributed without JSAAPL’s prior written consent.
In case you require any clarification or have any concern, kindly write to us at : [email protected]
