BLACK MONDAY
Corona and Crude Crush and Crash Markets
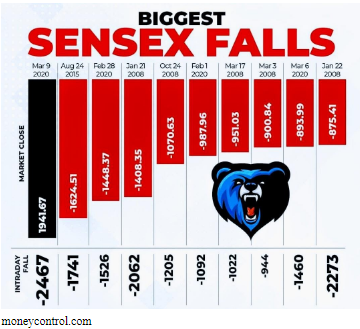
Markets freaked out yesterday. It was a BLACK Monday with record RED splashed across Global Financial Markets . Sensex plunged a record 1942 points to close down 5.17% at 35635 recovering a little from a higher intraday fall of 2467 points .The Dow too had a free fall closing down 2014 points and 7.79% at 23851
moneycontrol.com
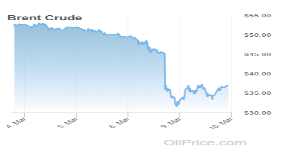
In a shock move at the weekend, Saudi Arabia triggered a Oil Price war to capture market share by significantly lowering Crude Oil Price by $ 6 to $ 8 for April 2020 deliveries after Russia refused on Friday at the OPEC Meeting in Vienna to agree for production cuts to support Oil Prices at US $ 50/barrel and counter the lower demand, especially from China, on account of the corona virus impact. On Friday itself Brent dropped to US $ 45/barrel plunging from near US $ 53/barrel to under US $ 32/barrel inside a week before recovering to over US $ 34/barrel. Not since January 17, 1991 Gulf War Times have we witnessed such a shock
The Corona Virus had already infected the Global Markets from the beginning of 2020 and is now on the verge of being declared pandemic by WHO as it spreads across the Globe affecting 115 countries and 114500 people with over 4000 deaths till date .Sensex from 41349 on January 1, 2020 had already corrected 9.1 % to 37577 on Friday, March 6, 2020
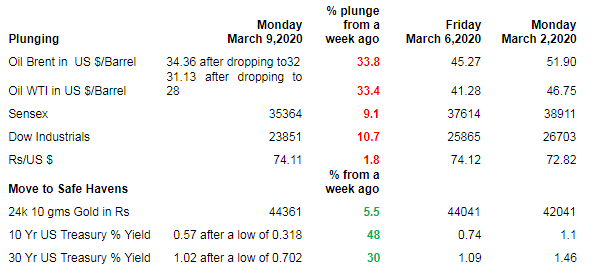
This is the Effect of BLACK MONDAY yesterday as panic volatility hit both Stocks & Bonds on the Oil Shock with a melt down on sell off in risk assets Stocks and a move to safer havens of US Treasuries causing yields to drop violently in the Treasuries as demand for them surged as did their price
| Plunging | Monday
March 9,2020 |
% plunge from a week ago | Friday
March 6,2020 |
Monday
March 2,2020 |
| Oil Brent in US $/Barrel | 34.36 after dropping to32 | 33.8 | 45.27 | 51.90 |
| Oil WTI in US $/Barrel | 31.13 after dropping to 28 | 33.4 | 41.28 | 46.75 |
| Sensex | 35364 | 9.1 | 37614 | 38911 |
| Dow Industrials | 23851 | 10.7 | 25865 | 26703 |
| Rs/US $ | 74.11 | 1.8 | 74.12 | 72.82 |
| Move to Safe Havens | % from a week ago | |||
| 24k 10 gms Gold in Rs | 44361 | 5.5 | 44041 | 42041 |
| 10 Yr US Treasury % Yield | 0.57 after a low of 0.318 | 48 | 0.74 | 1.1 |
| 30 Yr US Treasury % Yield | 1.02 after a low of 0.702 | 30 | 1.09 | 1.46 |
Jeena Scriptech Research
Just last month the 10 Year US Treasury quoted at 1.5% yield and in 2018 was available at near 3% yield
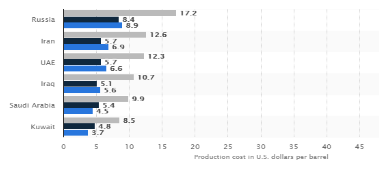
Saudi Arabia creates Turm-Oil
Saudi Arabia oil production costs are one of the lowest in the world
statista
With low production cost, Saudi Arabia can withstand lower oil prices for a longer time before any real threat to its oil dependent economy. Here are some economy pointers:
- GDP in 2019 was US $ 780 billion
- Fx Reserves at September 2019 were US $ 500 billion
- Exports are US $ 221 Billion largely from the export of Oil
- Oil Reserves are second largest after Venezuela at 260 billion barrels
- Annual Production is 3.5 billion barrels
Yet low Oil Prices can challenge the Vision 2030 endeavour of Saudi Arabia to wean dependency away from Oil Exports as even a US $ 20 drop per barrel would mean a loss of US $ 70 Billion in Revenues. Nearly 90 % of Budget Revenues are from the Petroleum Sector.
Thus lower Oil Prices will affect Saudi Arabia too in the longer run. So why this shock move to drop prices to capture market share? We see this as a twin effect power play to:
- Decimate US Shale Producers who have debt on their balance sheets and fracking costs being high cannot survive such low oil prices for long
- Drive sworn foe Iran, another oil export dependent nation, further into economic despair as it battles US and other sanctions
INDIA benefits from lower Oil Prices
India clearly will benefit from lower Oil prices with a prayer that the Rupee does not depreciate significantly
India is an Oil intense nation. According to the Petroleum Planning and Analysis Cell (PPAC) of the Ministry of Petroleum, India’s Oil Import Dependence has remained at over 80% in the past four years peaking at 83.7% in FY 19 with domestic Oil Output dropping to 34.2 mmtpa
Here’s India’s Oil Import Bill from FY 14 to FY 20 with the latter annualized and assumed based on 10 months data till January 2020 .The FY 20 Oil Basket will be lower than US $ 63.50 as taken as 2020 has seen Oil Prices drop. Thus our Import Bill for FY 20 should work out even lower than the assumed US $ 105.25 Billion
India’s Oil Imports from FY 14 to FY 20
| Year | 2013-14 | 2014-15 | 2015-16 | 2016-17 | 2017-18 | 2018-19 | 2019-20
(10 Months) |
2019-20 (Full Year assumed) |
| Imports
($ M) |
142,962 | 112,744 | 63,972 | 70,196 | 87,803 | 111,915 | 87,706 | 105,247 |
| Imports
(Rs Cr) |
864,875 | 687,416 | 416,579 | 470,159 | 566,450 | 783,183 | 617,344 | 740,813 |
| MMT | 189 | 189 | 203 | 214 | 220 | 226 | 188 | 226 |
| $/Barrel Basket | 105.52 | 84.16 | 46.17 | 47.56 | 56.43 | 69.88 | 63.5 | 63.50 |
Source: PPAC, Jeena Scriptech Research
Assuming we continue to import 226 mmtpa which is equivalent to @ 1660 m barrels our Import Bill and Savings in US $ Million at various levels of Oil Prices is shown below
| $/Barrel Basket | 20 | 25 | 30 | 35 | 40 | 45 | 50 |
| Imports | 33,205 | 41,506 | 49,807 | 58,108 | 66,409 | 74,710 | 83,012 |
| FY 20 Import at US $ 63.50/barrel | 105,247 | 105,247 | 105,247 | 105,247 | 105,247 | 105,247 | 105,247 |
| Savings | 72,042 | 63,741 | 55,440 | 47,139 | 38,838 | 30,537 | 22,235 |
Jeena Scriptech Research
India will save a significant US $ 22 Billion to US $ 55 Billion should Oil Prices remain in the lower US $ 30/barrel to US 50/barrel in FY 21.We remain one of the world’s largest importers of Oil with Iraq & Saudi Arabia being our major sources .India hopes to significantly reduce Oil import dependency by 2030 in the Energy Transition
This Savings will translate into a lower Fiscal Deficit.
| 2019-2020 | 2020-2021 | |
| Revised Estimate | Budget Estimate | |
| Budget Date | 1/2/2020 | 1/2/2020 |
| GDP (Rs Crs) | 2,04,42,233 | 2,24,89,420 |
| Nominal GDP Growth Rate % | 7.5 | 10 |
| Fiscal Deficit (Rs Crs) | 7,66,846 | 7,96,337 |
| Deficit / GDP % | 3.8 | 3.5 |
| Fiscal Deficit (US $ Billion at US $=Rs 74.11) | 107 | |
| Savings( US $ Billion) in Oil Imports at Oil Basket US $ 35/barrel from above table | (47) | |
| Adjusted Fiscal Deficit (US $ Billion) | 60 | |
| Adjusted Fiscal Deficit as a % of GDP | 2 |
Our Rupee has depreciated really worryingly in the past week from levels below Rs 72 to the US $ to Rs 74.11.With a prayer that such depreciation momentum is a one-off ,our Fiscal Deficit for FY 21 should drop to just 2% of the GDP not considering any further adjustments/revisions that may arise. One can expect the BJP led NDA Government to take credit for this just like the Congress led UPA Government has done in the past
As to why India only marginally passes on the benefit to Indian Consumers on Oil Price drops is a matter for debate for some other day. Suffice to say India uses such bonanza to prop up the economy, not adjust Government Projects expenditure downwards to cut deficit like forced in FY 20 revised estimates and facilitate lower government borrowings…but does it do so efficiently? Well, let’s debate that some other day and thus don’t expect the price of petrol to halve from Rs 80/litre even if the Oil Import Basket halves per barrel
India’s FX Reserves are US $ 481.5 Billion as on February 28, 2020.Expect these to cross for half a trillion Dollars in FY 21 boosted in part by a lower Oil Import Bill
Markets going forward
Stocks ~ Sensex & Dow will attempt a rebound after such a huge fall yesterday .Yet the sentiment and momentum should remain south with liquidity drying up and indices should seek further lower levels in 2020 as global recession kicks in and monies move towards safer havens and the discipline of asset allocation assumes its rightful importance as a survival tool .FPIs have withdrawn US $ 1.7 Billion in Equity in just seven trading days on Indian bourses in March 2020 as of yesterday. Today India is closed for the Holi festival
We don’t see any quick economic recovery in 2020 as we expect Oil Prices to remain at lower levels for this year pushing Oil Exporting Nations like Russia, Iran, South Africa, Nigeria, USA and Canada into further economic stress.
India, despite a year of lower interest rates and oil prices in the offing, is not in an immediate position to effectively leverage and benefit in a sustained manner as it will continue to be challenged for demand of products and services in both domestic and global markets and cross sectors. This will continue to stress exports and manufacturing, more so as the Corona Virus Impact plays out over 2020. As we have reiterated for several months now and even in our ‘Disconnect’ Standpoint of last month that there was a significant and visible disconnect between rising Indices and slowing GDP Growth on the strength of high liquidity. This disconnect is now rapidly reversing on the twin shocks of the corona virus and plunging crude prices. This will introduce some sanity back on Valuations on the bourses and give some great opportunities in value buying for the long term. Of course there will always be a few selections that will outperform even as indices correct
China, from where the Corona Virus has originated, continues to suffer from its consequences internally with lockdowns and shutdowns continuing. It being the second largest world economy will continue to affect Global Trade in 2020
In a Presidential Election Year, USA is facing potential recession which the optimists are opining will be short lived if it does envelope the nation. USA will be forced to lower domestic taxes and possible we may even see a Quantitative Easing IV being introduced to provide liquidity in their economy as the Shale Industry again gets destroyed on lower oil prices and unemployment woes re-surface.
Geo Political Conflicts will intensify across global hotspots in the Middle East and Asia as economic stress pushes Nations to the wall.
Gold ~ In the past few years it has been a ‘no brainer’ that Gold, despite not being Warren Buffett’s favorite investment asset as it’s not productive, would be the savior for capital protection .You must have at least 10% allocation in your Portfolio in Gold .Two Years ago in March 2018 Gold was at Rs 30000 for 24k 10 gms .It’s pushing towards Rs 45000 now giving a near 50% return in two years as Investors plough into safety in nervous and uncertain and worrying times. Gold will continue this northward momentum, albeit at a slower rate than past two years
US Bonds & Negative Interest Rate Securities and Deposits ~ Smart Monies are moving to safer havens in an uncertain world. When you tie in a really long term 30 year US Treasury for just 1% pa yield or even pay the Banks to keep your Monies you really are saying “ I think the Bear Markets are here to last beyond my death and I don’t wish to bear any more risk ” .Given what we see, live and breathe right now, we cannot argue with your thinking that protection of capital is more paramount than capital growth and that return of principal is more important than return on principal ~ this reality will continue for long
Conclusion
It’s a tough investment climate out there~Instead of earning ‘alpha’ from Stocks you may be sucking ‘lemons’ and post tax yields from Bonds/Bank Deposits may not cover inflation and it’s a prolonged real estate slump~then what should you do to make real gains post tax and inflation while protecting capital and staying true to your risk profile ?
We continue to reiterate the discipline of Asset Allocation based on Risk Profile. In our measured view, and as is often quoted, Rome was not built in a day while Nagasaki and Hiroshima fell in a day, you must invest in Direct Equity for the long term and every Asset Allocation exercise must have a Direct Equity component with Core and Non Core weightage and sound selection on various basis in sync with your risk profile
Wishing you a Happy Holi and the colour green rather than red in your equity portfolio
Disclosure & Disclaimer
Jeena Scriptech Alpha Advisors Pvt Ltd (JSAAPL) is a SEBI Registered Entity offering Fundamental Direct Equity Research Analysis, Equity Portfolio Advisory, Training & Mentoring Services in Capital Markets
This Report is under our free access SCRIP STANDPOINT Module.It is for the personal information of the recipient/reader. We are not soliciting any action based upon it. This report is not to be construed as an offer to sell or the solicitation of an offer to buy any security in any jurisdiction. It is our Viewpoint for general information purposes only. It does not take into account the particular investment objectives, financial situations, or needs of individuals & other entities .We have reviewed the report, and in so far as it includes current or historical information, it is believed to be reliable though its accuracy or completeness cannot be guaranteed. Neither JSAAPL, nor any person connected with it, accepts any liability arising from the use of this document. The recipients of this material should rely on their own investigations and take their own professional advice. Opinions expressed are our current opinions as of the date appearing on this material only. No part of this material may be duplicated in any form and/or redistributed without JSAAPL’s prior written consent.
In case you require any clarification or have any concern, kindly write to us at : [email protected]