VULNERABILITY ~ OF MARKETS AND VALUATIONS
Just too many Red Flags
Just too Many Red Flags
We have been living two unreal realities the past few months :
- the ongoing Covid-19 Pandemic that’s now stretched late into the second half of 2020
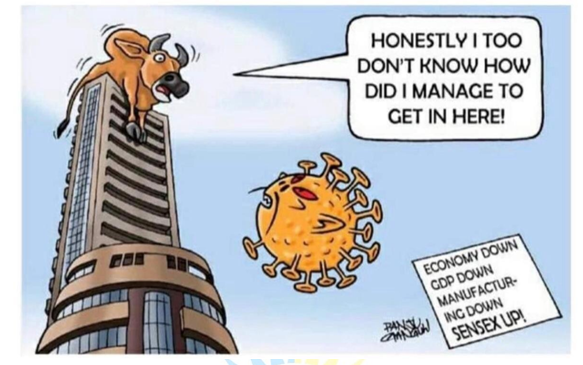
- the strength, speed and scale of the Stock Markets bouncing back after the March 2020 Global Meltdown.The March Meltdown played out FEAR with the Sensex crashing from near 43000 levels to sub 26000 and then bouncing back stunningly to play out GREED to cross 40000 on the morning of the last day in August 2020 before China Intrusion in Ladakh again at the weekend intruded the Sensex too and it closed at 38628, down 3.5% from the day’s high and closed the week on September 4,2020 at 38357.Pre November USA President Election Polls show Joe Biden leading incumbent President Donald Trump and that saw Nasdaq drop a sharp 5% in a day last week.Forewarning?
Correction is overdue, in that the stunning pullback has to pullback. In previous editions we’ve spelled out the disconnect between rising Stock Indices and declining Economies on the strength of Liquidity Flows .In this edition of SCRIP STANDPOINT we flag up Five striking Red Flags objectively as below that simply cannot be ignored despite high levels of Foreign Portfolio Investor (FPI) Equity Inflows (pumped in Rs 47080 crs near US $ 6.5 billion in August 2020) and the anticipation of a Covid-19 Vaccine this year itself and hopes of a V shaped recovery in economic growth in Q 2,3 & 4 of FY 21
- Record GDP De-Growth globally and with India worse than expected at -23.9% in Q1 FY 21 and Unemployment at 2%
- Record near 5.1 m new Demat Accounts opened in the lockdown period March to August 2020
- Market Cap to GDP Ratio at a record 2.2 times in the US and at a high of 0.84 times in India
- Nifty PE soars past 32,higher than even pre Lehman collapse in 2008 and nearly three times standard deviation
- Gold and Silver at record Highs
First however have a glance at how Global Indices fared in 2020 till date September 4,2020
|
Country |
Index |
Year Opening January
2020 |
Closing March 24, 2020 |
% Fall |
September 4, 2020 |
% Rise from March 24, 2020 |
% Fall/Rise from Jan-20 |
| North America | |||||||
| USA | Dow Jones | 28990 | 20705 | -28.6 | 28307 | 36.7 | -2.4 |
| USA | S&P 500 | 3258 | 2447 | -24.9 | 3429 | 40.1 | 5.3 |
| USA | NASDAQ 100 | 8794 | 7554 | -14.1 | 11505 | 52.3 | 30.8 |
| Canada | S&P/TSX 60 | 17100 | 11228 | -34.3 | 16368 | 45.8 | -4.3 |
| Mexico | IPC | 44437 | 34400 | -22.6 | 36430 | 5.9 | -18 |
| South America | |||||||
| Brazil | IBovespa | 118573 | 69729 | -41.2 | 100381 | 44 | -15.3 |
| Argentina | Merval 25 | 41107 | 25480 | -38.0 | 44800 | 75.8 | 9 |
| Chile | IGPA | 23985 | 10217 | -57.4 | 13139 | 28.6 | -45.2 |
| Europe | |||||||
|
Euro zone |
EURO STOXX 50 |
3793 |
2715 |
-28.4 |
3298 |
21.5 |
-13.1 |
| U K | FTSE 100 | 7604 | 5446 | -28.4 | 5849 | 7.4 | -23.1 |
| Netherlands | AEX | 613 | 462 | -24.6 | 547 | 18.4 | -10.8 |
| Belgium | BEL 20 | 4016 | 2868 | -28.6 | 3337 | 16.4 | -16.9 |
| Germany | DAX | 13386 | 9700 | -27.5 | 13006 | 34.1 | -2.8 |
| Russia | RTS | 1564 | 1081 | -30.9 | 1222 | 13 | -21.9 |
| France | CAC 40 | 6042 | 4243 | -29.8 | 5018 | 18.3 | -17 |
| Italy | FTSE Italia A | 25980 | 16949 | -34.8 | 19471 | 14.9 | -25.1 |
| Spain | IBEX 35 | 9691 | 6717 | -30.7 | 7066 | 5.2 | -27.1 |
| Switzerland | SMI | 10700 | 8733 | -18.4 | 10255 | 17.4 | -4.2 |
| Asia & Asia Pacific & Australia | |||||||
| China | Shanghai | 3085 | 2722 | -11.8 | 3355 | 23.3 | 8.8 |
| China | SZSE Comp | 10639 | 9922 | -6.7 | 13657 | 37.6 | 28.4 |
| Hong Kong | Hang Seng | 28544 | 22663 | -20.6 | 24695 | 9 | -13.5 |
| Singapore | Straits Times | 3238 | 2362 | -27.1 | 2510 | 6.3 | -22.5 |
| Japan | NIKKEI 225 | 23205 | 18092 | -22.0 | 23205 | 28.3 | – |
| Thailand | SET Composite | 1596 | 1034 | -35.2 | 1312 | 26.9 | -17.8 |
| Korea | KOSPI | 2175 | 1610 | -26.0 | 2368 | 47.1 | 8.9 |
| India | Sensex | 41306 | 26674 | -35.4 | 38357 | 43.8 | -7.1 |
| India | Nifty | 12183 | 7801 | -36.0 | 11334 | 45.3 | -7 |
| Australia | S&P ASX20 | 3762 | 2728 | -27.5 | 3208 | 17.6 | -14.7 |
Global Indices across the continents have pulled back smartly from the March 24,2020 Meltdown that had got the world shivering of a Financial Armageddon being unleashed at the time. In fact the US ( S & P 500 and Nasdaq ),Argentina,China and Korea Indices are currently at higher levels in eight months of 2020 than what they were when 2020 dawned and our own Nifty and Sensex have been in the same pack but yet have to be in the green for the year to date even after a remarkable pullback of 44% & 45% respectively from March Lows .Europe is yet considerably down.
What is most striking is that it’s been a rocking NASDAQ 2020 Tech Story thus far .After dropping 14% in March from the January opening ,it has surged 72% from March Lows and is now 31% over even January Opening
In our March 15,2020 edition here’s what we had opined :
“It is difficult to call the bottom as it’s difficult to call the duration, spread and intensity of COVID- 19.But it’s easy to call ,based on historic evidence, that after this crisis passes and after any US & Global Recession the bounce back in Equities will be significant in the years ahead. These declines are introducing some sanity back on Valuations on the bourses and give some great opportunities in value buying for the long term
Major Spoilers for any recovery later in 2020 could be that the COVID-19 crisis prolongs late into 2020 and hopefully not into 2021 and Geo Political Conflicts will intensify across global hotspots in the Middle East and Asia as economic stress pushes Nations to the wall.”
Both Spoilers have played up as Covid-19 Pandemic has stretched into the second half of 2020 and the India-China Border Skirmish that had escalated violently in June 2020 with hand to hand combat in the Galwan Valley resulting in tens of deaths of soldiers on both sides has refused to die down with China violating the agreed Line of Control last weekend
Significant Correction is again indicated and it will come very soon ~ this month, next or by November.We’ll be surprised if it does not. Caution needs to be exercised with strict discipline of Asset Allocation and maintaining Cash and Core in Direct Equity at a sound tactical weightage.
Let’s raise the Five Red Flags
- ~ Record GDP De-Growth globally
Q1 FY 2020 Official GDP Figures for India have been released and shows a huge contraction of a record 23.9% largely due to a fall in manufacturing (-39.3%), construction (-50.3%) and Travel and Hospitality (-47%) activities
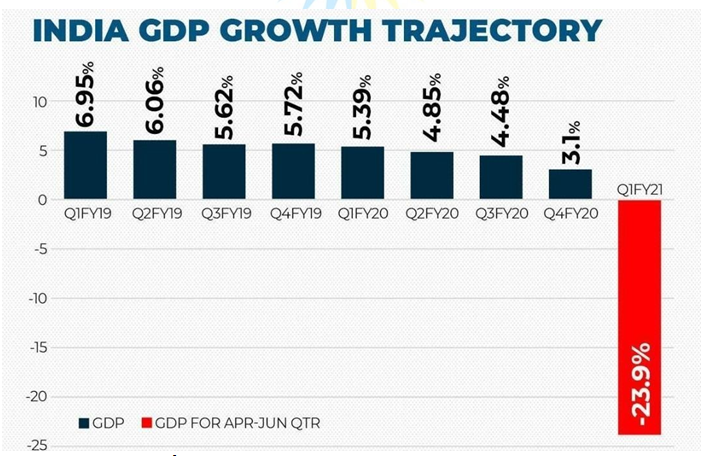
Source : Moneycontrol
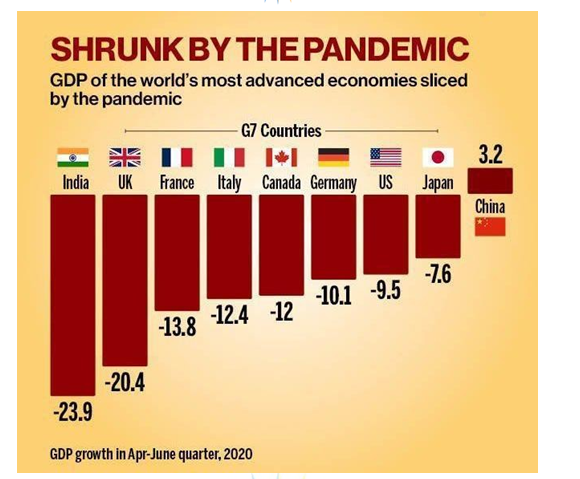
Source : Business Today
This Q 1 FY GDP Contraction points to a 10% fall in India’s GDP in FY 21 despite the V Shaped recovery in the remaining three quarters being forecast by a few market commentators and the Finance Ministry.The Fiscal Deficit in the four months April to July 2020 period stands at Rs 8.2 lakh crs (previous year Rs 5.47 lakh crs) ~ that’s already at 103% of the full FY 21 target deficit of Rs 7.96 lakh crs.Loss of Economic Output at such a staggering level has led to stunning loss of jobs that reflects in soaring and alarming Unemployment at 8.2% as on date.It’s recovered from a peak of 23.5% in April 2020 when 121 m were unemployed. Provisional FY 20 GDP is Rs 203.4 lakh crs => Estimated FY 21 GDP will be Rs 183.1 lakh crs at -10% fall
Such an Economic disconcerting narrative and yet a soaring Sensex and Nifty? Some commentators are plugging the government line and don’t see the stark disconnect despite the RBI Governor
,Shaktikanta Das, warning a fortnight ago “There is so much liquidity in the system ,in the global economy,that’s why the stock market is very buoyant and it is definitely disconnected with the real economy.There will definitely be a correction but we can’t say when”
2 ~ Record 5.1 million new Demat Accounts opened in the lockdown months
A record 5.1 m new Demat Accounts have been opened in the six months March to August 2020 lockdown period.
| Month in 2020 | New Demat Accounts Opened inMillion |
| March | 0.7 |
| April | 0.7 |
| May | 0.7 |
| June | 1 |
| July | 0.9 |
| August | 1.1 |
| Record No of Demat Acs Opened March-August 2020 | 5.1 |
Source : CDSL/NSDL
Compare this with 2.7 m accounts opened in the previous six month period of September 2019 to February 2020 At August 31,2020 the Total Number of Demat Accounts have crossed 45 million.Just five years ago they had closed FY 16 at just past 25 m growing at about a million a year.Post Demonetisation in November 2016 we’ve witnessed a burst of demat accounts being opened with 2.8 m in FY 17, 4 m in both FY 18 and FY 19 and 4.9 m in FY 20.In FY 21 already 4.4 m accounts have been opened in the five months till August 31,2020
While this is a promising indicator for an increasing % weightage allocation in the Equity Component in an Investment Portfolio, the sudden burst of demat accounts flags up heightened risk as most accounts are retail driven in the lower age group .This young age group may have aggressive profiles but lack the experience and fundamental skills and knowledge to make sound equity selections.
Why this sudden burst of new demat accounts in this Covid-19 ongoing Pandemic ?
Well,clearly the Pandemic has been the alarming catalyst. With growing nervousness and uncertainty on the Business Earnings and Employment front and the low interest rates scenario expected to stay over the next two years at least, Equity is increasingly being seen as an Income Stream that will support survival with the seducer being this scale and speed of pullback in Stocks since the March 2020 meltdown. In fact Millions more accounts should be opened as the LIC IPO draws nearer. It’s now expected in 2021.Millions of LIC Insurance Policy Holders who thus far have no Equity exposure and don’t possess a Demat Account will decide to become LIC Shareholders too and would need to open a Demat Account
The Risk associated with Equity has been put on the backseat as Robinhood Trading ,as we see this, take over. This is a Front Seat Concern for us.Time and Again we have seen Retail and Small Investors being burnt in Indian Equity Markets in the 1990s and in this Millennium when they enter at lag ends of bull runs and are swept away in the crash and significant corrections that follow.We visualize a re-run of this sad scenario
3 ~ Market Cap to GDP Ratio at a record levels in USA and India
The Market Capitalisation to GDP Ratio in USA and India has surged .Take a look.
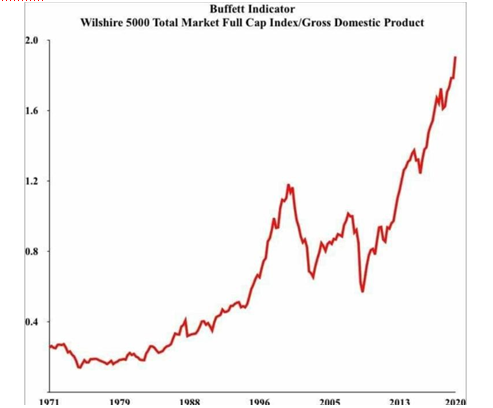
The Ratio shows a strongly overvalued US Market and a correction is strongly indicated
Here’s the Indian Market Cap/GDP Story in 2020
| Date | Sensex Level | Market Cap
(Rs Crs) |
Mkt Cap/GDP | |
| All Time High | January 20,2020 | 42274 | 1,59,28,030 | 0.78 |
| 52 Week Low | March 24,2020 | 25639 | 1,03,69,706 | 0.51 |
| Current | September 4,2020 | 38357 | 1,54,50,052 | 0.84* |
* On FY 21 Estimated GDP assuming -10% fall in GDP
Provisional FY 20 GDP is Rs 203.4 lakh crs => Estimated FY 21 GDP Rs 183.1 lakh crs at -10% fall
In 2007 Pre Lehman bull run era this Ratio was at a bold Red 1.92 in India and the crash that followed took it to 0.52 inside months as can be seen below.This low level was touched late March 2020 this year in the meltdown and at the time we had issued a SCRIP STANDPOINT that revolved around Cash, Courage & Conviction to take advantage of great value opportunities
Here’s the Indian Market Cap/GDP Trend 2006 to 2015
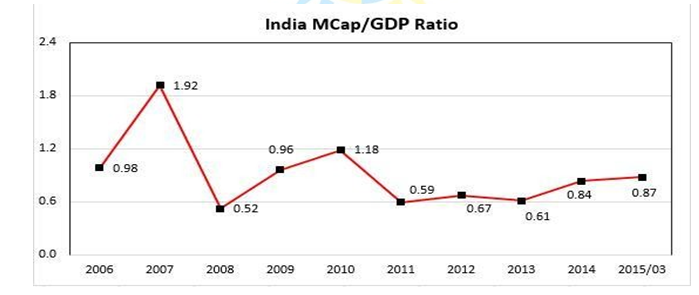
The Market Cap/GDP Ratio is now at 0.84.That may not seem as alarming as the 1.92 we witnessed in 2007.Yet after being at 0.65 to 0.75 levels in recent years the move up to current level of 0.84,last seen in euphoric 2014 and 2015 when the BJP Party lead a coalition back to power on the Modi wave, raises concern
4 ~ Nifty PE soars past 32,higher than even pre Lehman collapse in 2008 and nearly three times standard deviation
T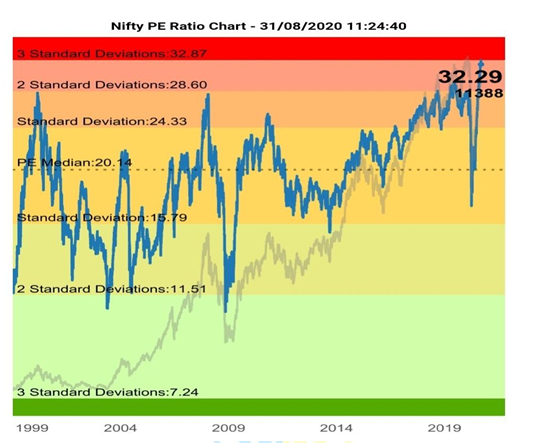
he Nifty PE has soared past 32.We last saw 30 at the turn of the Millennium in 2000/2001 in the Ketan Parekh led ICE Bull Run.Before this we also saw it at crazy 64 levels in 1991/92 in the late Harshad Mehta led Bull Run. The subsequent market decimation post these bull runs decimated many.
Even Pre Lehman 2007 Bull Market never saw the Nifty PE at above 30.Now at past 32 and near three standard deviations it is one of the most striking red flags that’s screaming out a loud warning that Rising Stock Market Levels are out of sync with expected lower Corporate Earnings in FY 21 and a correction is strongly indicated. Making hay while this suns shines are innumerable penny stocks on BSE too that have soared without fundamental justification sucking in especially retail investors.
- ~ Gold and Silver at record Highs
| Date | Gold US $/oz | Silver US $ /oz | Gold/Silver Ratio |
| August 3,2018 | 1214.59 | 15.44 | 78.7 |
| September 13,2019 | 1490.65 | 17.57 | 84.84 |
| July 3,2020 | 1775 | 18.05 | 98.34 |
| September 4,2020 | 1933.52 | 26.72 | 72.36 |
In the past two years ,after being relatively calm for many years, Gold and Silver have surged 60% and 73% respectively ,reflecting the rising demand for bullion in rising global nervousness and uncertainty on many fronts, economic and geo-political and now Covid helplessness leading the way.In periods of global stress, like at present, Bullion serves as a hedge and sees demand led price rising and should be inversely co-related to Stocks.Yet we find a scenario where both Bullion and Stocks are rising
Conclusion
Caution Red Flags are getting more striking every day warning of a significant Stock Market Reversal. Though it may be not be as intense, sudden and scary as we witnessed in the March Meltdown this year when the Oil Shock and Covid Pandemic Scare were the powerful triggers.
Strict discipline of Asset Allocation needs to be adhered to while balancing out Greed,Fear and Risk and maintaining Cash and Long Term Core in Direct Equity at a sound tactical weightage.
Low Yields are driving increased risk taking and thus driving this rally in Stocks and taking prices and valuations through the ceiling. Bulls are taking comfort in this and there is danger of being lulled into a false sense of security and complacency in that that this rally will go on and on and on as long as the US Fed keeps expanding it’s balance sheet (record Trillions of Dollars already this year) to provide liquidity support. Yet, there’s got to be a Limit.
A Healthy Correction will bring back sanity to Valuations and make a sound base for a sustainable Recovery later in 2021 hopefully in a post Covid era and on a global economic recovery regardless of whether incumbent President Trump trumps the November US Elections or contender Joe Biden does.
Of course Trump has repeatedly warned ,first in June 2019 then again in September 2019 and just a few days ago too on September 2,2020 when Dow crossed 29000,that if he’s not re-elected, the Stock Markets Crash that will follow will be Epic and nothing like anything one has ever seen before
Now would it not be amusing that Trump is re-elected and yet the Stock Markets go down !
Let’s not wait to find out though. Better Safe than Sorry & always good to take trading and investment gains of the Equity Table and even reduce Equity Exposure for now .One can always get back in when there’s some clarity and stability on especially the economic and geo-political front or when we see the imminent launch of a genuine Covid Vaccine
Cheers,
Gaurav Parikh, Managing Director [email protected] +9820162597
Disclosure & Disclaimer
This Report is under our free access SCRIP STANDPOINT Module.It is for the personal information of the recipient/reader. We are not soliciting any action based upon it. This report is not to be construed as an offer to sell or the solicitation of an offer to buy any security in any jurisdiction. It is our Viewpoint for general information purposes only. It does not take into account the particular investment objectives, financial situations, or needs of individuals & other entities .We have reviewed the report, and in so far as it includes current or historical information, it is believed to be reliable though its accuracy or completeness cannot be guaranteed. Neither JSAAPL, nor any person connected with it, accepts any liability arising from the use of this document. The recipients of this material should rely on their own investigations and take their own professional advice. Opinions expressed are our current opinions as of the date appearing on this material only. No part of this material may be duplicated in any form and/or redistributed without JSAAPL’s prior written consent.In case you require any clarification or have any concern, kindly write to us at: [email protected]
Regd Office: Jeena House, Plot No 170, Om Nagar off Pipeline Road, Andheri (East), Mumbai 400099, Maharashtra, India Corporate Office: Elphinstone Bldg, 1st Fl, Above Starbucks & Croma, Veer Nariman Rd, Horniman Circle, Fort, Mumbai 400001 Tel: +91 22 62999117 /138 ~ Email: [email protected] ~ Website: www.jsalphaa.com ~ CIN: U74999MH2010PTC210730 SEBI Research Analyst Registration : INH000006907 ~ SEBI Investment Adviser Registration : INA000013217