S & P BSE SENSEX 52843 ~ Down but Not Out ! ~ Nyet?
Is Russia really Isolated ? ~ US Fed Rate Rise Dilemma ~ Impact on India
War is Ugly .Make no Mistake .There is no Winner. Civilian Casualties are sadly termed as collateral damage.
The Russian invasion of Ukraine on February 24,2022 triggered global concern and indignation and it quickly started disrupting commodities and currencies. The surge in prices across oil, metals and agricultural products is beginning to raise serious economic implications with supply constraints intensifying pressures on inflation and currency
In 2020 we began to be severely tested by the ‘P’andemic that continues to date .We grappled with tongue twisting Remdesivir, Mucormycosis , Tocilizumab and the full form of RT-PCR.Now in 2022 we have to deal with ‘P’utin, full name Vladimir Vladimirovich Putin ,Volodymyr Oleksandrovych Zelenskyy, Surgey Kuzhugetovich Shoigu ,Kravchuk and Yanukovych !
This Scrip Standpoint is in three Parts and endeavors to validate many economic concerns that have intensified with this conflict and offers our perspective with data support .Urge you to read all Parts.
Part I ~ Russia Invasion of Ukraine : Is Russia staring down an economic barrel?
Part II ~ USA Federal Reserve : Balance Sheet and Federal Funds Rate Dilemma
Part III ~ India : Impact on Stock Markets and our Rupee with Oil on the Boil
Over Eight Months ago, on June 30,2021, we had released a Scrip Standpoint flagging up valuation concerns in a market that was running away .It was titled as below
S & P BSE SENSEX 52483
Greed is Good! ~ Really!?
Sensex is back to this level with an uncanny juxta positioning of the Numbers 4 and 8 ! after zooming to an All Time High of 62245 on October 19,2021.More on this in Part III
Let’s begin with Part I on the Russian Invasion of Ukraine
PART I
Russia and Ukraine Military Conflict : Is Russia staring down an economic barrel?
Is Russia really isolated ?
This is the UN General Assembly Resolution Vote last week that demanded Russia “immediately, completely and unconditionally” withdraw its military forces from Ukraine
India abstained .Interestingly ,but not surprisingly ,many African nations did so too.
“ Whoever does not miss the Soviet Union has no heart. Whoever wants it back has no brain” – Vladimir Putin
An all-out Russia and Ukraine conflict was waiting to happen for many years and now it’s into the 12th day and clearly with no immediate end in sight .Check out the two one-hour documentaries on Docubay, requires separate subscription within Amazon Prime, to get a sense of why Putin is doing what he is doing in Ukraine. ‘Putin: The New Empire’ (2020) and The Frontier : Ukraine (2019).
Is Russia really isolated ? as the Western Media forcefully portrays. With nearly a fourth of the Nations abstaining or voting against the above UN Resolution, Russia clearly has a support base across many nations in the four continents of Asia, Africa, Europe and South America
The gameplan is deeper with end goal of breaking the hegemony of the US Dollar and its domination in Global Oil and Gas Trade. China is lending tacit support in the renewed attempt to recalibrate World Economic and Political Order .
Russia initiating military operations in Ukraine on February 24,2022 is the trigger.
Can Russia be destroyed economically by unprecedented sanctions that continue to be imposed on it in the wake of its aggression in Ukraine ?
Russia has been moving away from Dependency on the West and its Allies for many years and in our view, sanctions will cause hardship but not destroy the Russian Economy which saw a GDP of US $ 1.5 Trillion in 2021 with exports at US $ 490 Billion of which over half were Oil and Gas.
Here’s what Russia was and is up to :
- Disinvesting in US Treasuries ~ In 2010 Russia was in the Top 10 Overseas Owners of US Treasury with US $ 176.3 billion in Value. Ten Years later as on September 30,2021 it barely has any and does not figure even in the Top 30 Owners.
As on September 30,2021 USA had US $ 7.55 Trillion worth Treasury Bills held Overseas. Here are the Top 14 Nations that held most of them:
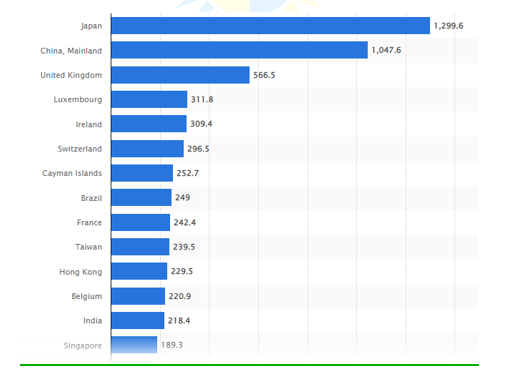
www.statista.com
- Strengthening Gold Reserves ~ Russia’s Gold Reserves have climbed officially to 2300 Tonnes, and it reportedly holds 7000 tonnes unmined .Here are the Top Gold Holding Nations with Holdings in Tonnes :
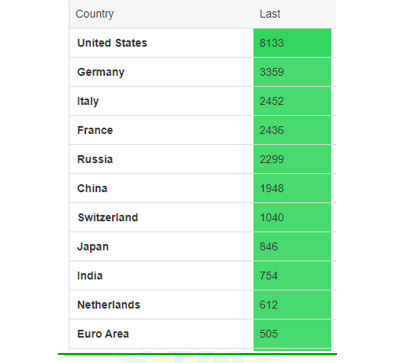
www.tradingeconomics.com
- International Reserves : The Central Bank of Russia website cbr.ru reported that Russia had International Reserves of US $ 630 Billion as on January 31,2022 ,more or less like India’s Fx Reserves .Of these Foreign Currencies comprised US $ 498 Billion and Gold was at US $ 132 Billion .A Year earlier the International Reserves were lower at US $ 591 Billion .
- Oil and Gas Exports : The International Energy Agency website iea.org reports that the Russian invasion of Ukraine on February 24,2022 has yet not resulted in the loss of oil supply to the global markets. Russia is the third largest oil producer in the world after USA (17.6 mb/d)and Saudi Arabia(12 mb/d) .In January 2022 Russia produced 10 mb/day .Russia also is the largest exporter of Oil and Gas in the world and second only to Saudi Arabia for Crude Oil. About 60% of Russia’s oil exports go to Organisation of Economic Co-operation and Development (OECD) Europe, and another 20% go to China. China, in fact, is the largest single buyer of Russian oil, taking 1.6 mb/d of crude on average in 2021, equally divided between pipeline and seaborne routes.Early in February 2022 Russia and China entered a new 30-year contract to supply gas to China via a new pipeline and will settle the new gas sales in euros. Gazprom , which has a monopoly on Russian gas exports by pipeline, agreed to supply Chinese state energy major CNPC with 10 billion cubic metres of gas a year. From 2019 China already receives Russian Gas through the 4000 km’ Power of Siberia’ pipeline and liquefied natural gas (LNG) by sea route. Russia exported 16.5 billion cubic metres (bcm) of gas to China in 2021.Russia had targeted to supply China with 38 bcm of gas by pipeline by 2025.This new Deal raises the target to 48 bcm by 2026
2021 has been a super year for Russia as it’s Oil and Gas Revenues at US $ 119 billion exceeded targets which were set at US $ 45/barrel when actually US $ 69/barrel was the realisation. Natural Gas Exports were targeted at US $ 156.3 per 1000 cubic metres but Gazprom, the Russian Gas Giant commented it would reach US $ 280
Just look at today’s Oil and Gas Prices in the charts below ! The West is yet considering an oil and gas embargo on Russia but if they do so without alternate sourcing, their own economies will suffer .In fact the European Union’s sanctions to close access to Russia to the Society for Worldwide Interbank Financial Telecommunications (SWIFT) ,a messaging service that facilitates settlement of international payments is restricted to seven Russian Banks but deliberately have excluded Sberbank ,the largest Russian Bank that holds more than half of Russia’s deposits and serves over 100 million retail customers, and Gazprombank in which Gazprom has a stake. The reason is clear and will appear as hypocrisy to many European Nations depend on Russian Oil and Gas and any supply block on this front will create huge challenges to their own economies
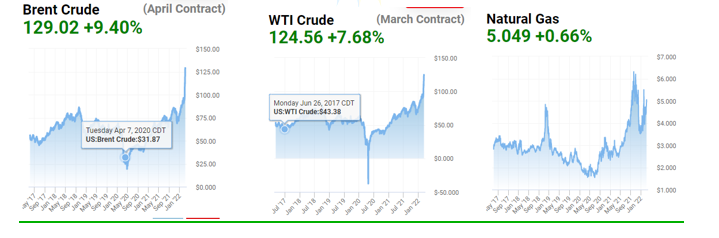
www.oilprice.com
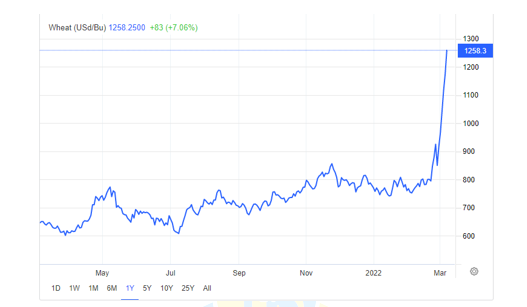
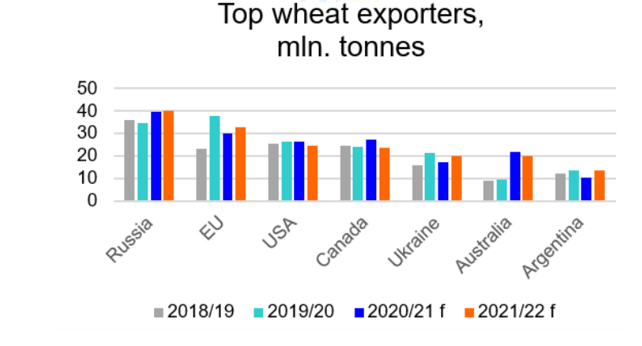
· Wheat Exports : Russia and Ukraine are two of the world’s largest producers and exporters of Wheat .The Ukraine Invasion has rocketed the Chicago Wheat Futures past US $ 12.50/bushel ,a level last seen way back in March 2008. Exports from the Black Sea have trickled down with closure of facilities of big Multinational food companies in the region and the suspension of shipping services to Russia by the world’s biggest container ship operator, Maersk/MSC.
The Ukraine Invasion caused this immediate capitulation to Russia :
- Ruble plunged 40% to 106/US $ from 76 levels
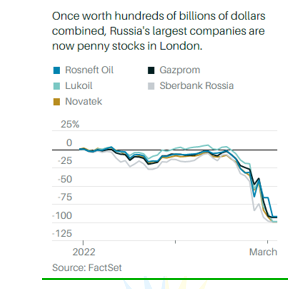
- Near Full Wipe-off of Market Capitalisation of Russian Companies listed on London Stock Exchanges
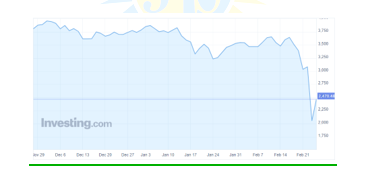
- Russia’s own MOEX Shares Index plunged 33.3 % from 3000 levels to below 2000 before a bounce to 2500 levels and the Exchange operations remain suspended since the day after the Ukraine Invasion
One may wonder if Russia can withstand such currency debasement and dollar denominated stock valuations vaporizing and constraints on exports . Despite its richness of natural resources, the GDP stands moderate at US $ 1.5 Trillion. The reason is that unlike Italy and other Nations, Russia exports these resources in their natural state without any serious value add .
The Putin Plan is clear now. In his lifetime he wants the World Economic and Political Order to ease away from Western Domination and the US Dollar reduced to just a Currency and not mandatory for settlement of Global Oil and Gas Trades. China needs to extend more than just tacit support for this Plan to succeed .
In 2012 just after US SWIFT Sanctions on Iran for its Nuclear Program, China began developing their own Cross-border Interbank Payment System (CIPS) and launched it in 2015 for use between Hong Kong and China.
In 2014 Russia, threatened to be excluded from SWIFT during the Crimea crisis began work on creating SPFS (Financial Message Transfer System), using the same technology available to both SWIFT and CIPS. It was launched in 2017 and is used by subsidiaries of the large Russian banks in Germany and Switzerland to facilitate transactions with Russia.
With Strong Gold and International Reserves ,Surging Commodity Prices, and support from China to increase exports to it , Russia should be able to withstand pressure on its economy. It will be a while before a viable scale and scope alternative to SWIFT will emerge
Like the Pandemic in 2020, the Russia Ukraine Conflict too is going to prolong, and we don’t see any Russian U-Turn. However, we don’t see any major escalation too that will bring in the NATO alliance to combat the Russians directly. Germany’s Chancellor Scholz has just made a statement today that Germany has no plans to halt Russian Energy Imports and that the European Energy needs cannot be secured without such Imports .Germany had also wanted the two major Russian Banks to continue having access to SWIFT.NATO also has rejected Ukraine’s plea to make their skies a ‘No-Fly’ zone .Doing so would have meant NATO alliance planes would need to patrol Ukraine Skies and thus being drawn into the Conflict
It would be naïve to assume this is just a clashing of belief systems of ideologies and governance ~ of Free Societies and Democracies vs Totalitarian Regimes
Nyet ! it’s much more than this .
Let’s move to Part II on US Federal Reserve and its Doings to combat the Pandemic
PART II
USA Federal Reserve : Balance Sheet and Federal Funds Rate Dilemma
“This is the time to use the great fiscal power of the United States to do what we can to support the economy. Those are going to be key policies that will come with a hefty price tag.” – Jerome Powell ,US Federal Reserve Chairperson, April 2020
This was part of Jerome Powell’s address to the US Congress at the onset of the pandemic in 2020 where the US Fed committed to keep the Federal Funds rate near zero and pump in unprecedented liquidity into the economy through both means of printing additional currency as well as buying state government bonds and mortgage-backed securities
What was the hefty price he was referring to ?
Have a look at this table
| US Combined Federal Reserve Banks Balance Sheet Size in US $ Trillion | ||||
| Head | December 31,2019 | December 31,2020 | September 30,2021 | March 3,2022 |
| Balance Sheet Size | 4.17 | 7.36 | 8.45 | 8.95 |
| Extracts | ||||
| US Treasury Securities | 2.4 | 4.96 | 5.7 | 5.74 |
| Mortgage-backed Securities | 1.45 | 2.11 | 2.57 | 2.7 |
www.federalreserve.gov jeena scriptech research
The US Fed Balance Sheet has more than doubled in size in just two years
The Effective Federal Funds Rate is 0.08% and is maintained < 0.25% in the last two years
| March 3,2022 | 2018 | 2008 | 2000 | |
| US Federal Funds Rate % | 0.08 | Average 1.8
Closing 2.4 |
Average 1.92
Closing 0.14 |
Average 6.24
Closing 5.41 |
| Inflation % | January 2022 7.5 | Average 2.4
Highest 2.9 Closing 1.9 |
Average 3.8
Highest 5.6 Closing 0.1 |
Average 3.4
Highest 3.8 Closing 3.4 |
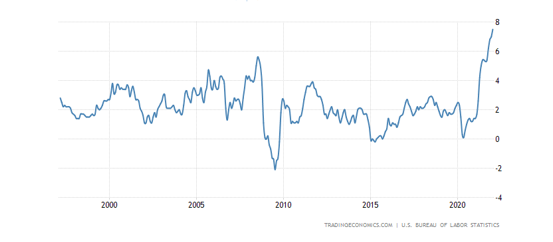
US Inflation has surged to 7.5% (graph below) with the supply chain clogged in 2021 .It is becoming an untenable position to keep the Federal Funds Rate near zero
The US Fed did not raise the rate in January 2022 but is committed to do so in 2022 along with tapering (gradually reducing the quantum of buying of bonds and securities ,thus reducing liquidity support ). US Fed is widely expected to raise the rate in its next scheduled two-day meeting on March 15-16,2022 and then again, several times more in 2022
Yes, such Inflation could be transitory but given the Russia Ukraine Conflict it is unlikely that the Supply Chain gets unclogged soon in 2022 as was expected earlier. We don’t want to open a debate thread whether rising US Inflation is a factor of increasing money supply and liquidity or more of a demand-supply issue .
You can observe that the gap between the Inflation Rate and the US Fed Rate has been managed and controlled inside a few basis points in earlier years .Post Lehman crisis in 2008 the Fed rate too was near zero ,but inflation too had closed the year at a low and the US Fed had the twin responsibility of propping up the US Economy as well as the Financial Institutions that were on the verge of collapse
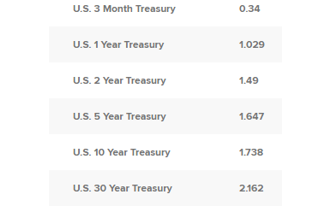
Keep an eye on the gap between the US 2 year and 10-year treasury yields too as below . Historically an inverted yield when 2-year bonds command a higher yield than 10-year bonds ,has unfailingly signaled recession ahead.
Another interesting statistic is the US Debt to GDP ratio. The bar Chart below shows that it has always been over 100% in the last decade
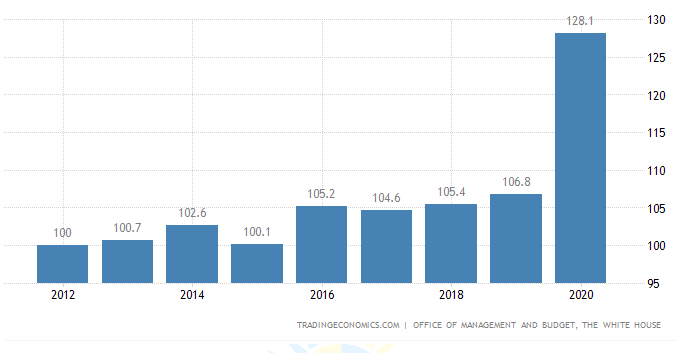
In context ,Russia has a 20% ratio and India under 90%
US Yields are inevitably going to rise on Fed Rate Rise to bridge the Inflation and Fed rate gap. It’s only a question of ‘When ? ‘ And by how much each time .We expect the Fed Rate to cross 1.5% this year at the least when it should ideally be over 2% even if given that Inflation will temper down from 7.5% to under 4.5 % .
However, given the Russia Ukraine conflict will the US Fed yet again defer the rate increase at its meeting next week mid-March ?
Impact on US Equities is already evident with the Dow Jones Industrial Average down 10% from near 37000 levels it opened in 2022 to @ 33250 levels now. The Nasdaq corrected even sharper at 15% in the same period from 15600 levels it opened 2022 to 13230 levels currently . Apple has corrected 10% while Meta Platforms (Facebook) has plunged over 40% thus far in the two months and a week in March thus far in 2022 with the 25% plunge on February 3,2022 being the largest ever in US History by a company in a single day. This was on declaration of weak results by Meta .
Let’s move to Part III on Impact on India
PART III
After an insane post pandemic run from the March 2020 Sensex low of 25639 to an intoxicating All Time High of 62245 in October 2021 it’s been mostly downhill in the five months since then.
Have a look at the Sensex run in various periods in the past two years
S & P BSE Sensex
| Period | From | To | Rise | % Rise |
| Pandemic Low March 24,2020 till date March 7,2022 | 25639 | 52843 | 27204 | 106 |
| FY 21 ~ March 31,2020 to March 31,2021 | 29468 | 49509 | 20041 | 68 |
| FY 22 ~ March 31,2021 to ATM October 19,2021 | 49509 | 62245 | 12736 | 25.7 |
| FY 22 ~ March 31,2021 to date March 7,2022 | 49509 | 52843 | 3334 | 6.7 |
| FY 22 ~ ATH October 19,2021 to March 7, 2022 | 62245 | 52843 | (9402) | (15.1) |
| CY 2020 ~ December 31,2109 to December 31,2020 | 41254 | 47751 | 6497 | 16 |
| CY 2021~December 31,2020 to December 31,2021 | 47751 | 58254 | 10503 | 22 |
| CY 2022 till date March 7,2022 | 58254 | 52843 | (5411) | (9.3) |
CY ~ Calendar Year January to December FY ~ Financial Year April to March
Sensex soared to an All Time High of 62245 on October 19,2021 ,a surge of 12736 point and 25.7% in FY 22 till then before correcting sharply down 9402 points and 15.1 % to 52843 right now and in danger of wiping out the FY 22 gains of just under 7% before closing out March this month
We have been continuously raising red flags in 2021 on valuations that would stress out markets causing volatility and vulnerability and urging for Asset Allocation in sync with Risk Profiles and a Long-Term Equity Mindset with Direct Equity Portfolio being a strong mix of Core and Non-Core Fundamental Selections with appropriate weightage . Drawdowns are more accentuated in Non-Core Selections, and one needs to bear them out. A Trading mindset works well in a Bull Market that we witnessed post pandemic and complacency and even arrogance makes one mistake luck for skills .It is however a Bear Market that truly tests one’s Temperament in Equity and we may be in it already .
Consciously our last SS Recommendation was on December 9,2021 nearly three months ago and even in our June 30,2021 Scrip Standpoint we had opined this which we reproduce below :
“It is highly unlikely and there is limited scope that the Sensex will maintain its momentum and move into the 55000 to 60000 range with confidence and assurance .What flags up as Red is the continuing surges in MidCaps and SmallCaps and we remain concerned at the commentary by many that there is yet lots of steam in these segments in the short term. Be Selective.
It’s difficult to spot fundamental value in these elevated markets. This has translated into fewer recommendations and making allowance for increased risk in growth and turnaround opportunities.
Normally we request clients to think three years and not three minutes or three months when investing in Direct Equity in India. These are not ‘Normal’ times and thus we are making allowance for any major correction globally in Equities in the coming year or two and have commenced advising clients to look even beyond 2025 and into the end of the decade 2030 and maintain the discipline of Asset Allocation to protect Wealth.
This would position the Portfolio to withstand any potential shock in the short and medium term and avoid a scenario where wealth grown in equities in 2020-2022 gets decisively decimated in 2022-2023. Investors, of course must have the temperament to tolerate drawdowns in long term compounders.”
What Now ?
Have conveyed more than once in one-to-one interactions that 52000 Sensex level is what is more comfortable to us on valuations .It’s reaching there and may even drop below 50000 throwing up really great value opportunities .
This is what explains the Smile on our Face despite the grim reality of ongoing strife in geo-political hotspots around the globe with the latest one in Ukraine and the humanitarian crisis that inevitably arises with civilian hardships and casualties and refugee exodus to neighboring countries .
Current BSE Market Cap on March 7,2022 closing is Rs 24110831 crs ( US $ 3.13 T at Rs 77/US $) . The Union Budget has projected a FY 23 GDP of Rs 25800000 crs ( US $ 3.35 T ) .This brings down our Mkt Cap /GDP to below 1
However, going forward these two concerns remain :
- Oil on the Boil and Rupee Spiking
- Record Outflows by Foreign Portfolio Investors (FPIs)
Oil on the Boil
Surging Oil and Gas Charts have been given in Part 1 .
Have a look at our Oil Imports to assess Impact of Oil Surges on the Oil Bill and Rupee
| 10 Months FY 22 | FY 21 | FY 20 | |||||||
| IMPORTS | MMT | Rs Crs | US $ B | MMT | Rs Crs | US $ B | MMT | Rs Crs | US $ B |
| Crude Oil | 175.9 | 701078 | 94.3 | 196.5 | 459779 | 62.3 | 227 | 717001 | 101.4 |
| Other Products | 33.6 | 147897 | 19.9 | 43.3 | 109430 | 14.8 | 43.8 | 125742 | 17.7 |
| Total Imports | 209.5 | 848975 | 114.2 | 239.8 | 569209 | 77.1 | 270.8 | 842743 | 119.1 |
| EXPORTS | |||||||||
| Other Products | 51.1 | 247755 | 33.4 | 56.8 | 157168 | 21.4 | 65.7 | 254018 | 35.8 |
| NET IMPORTS | 158.4 | 601220 | 80.8 | 183 | 412041 | 55.7 | 205.1 | 588725 | 83.3 |
| Does not include LNG Imports which were @ US $ 8.7 b or @ Rs 65000 crs in FY 22 till December 2021 | |||||||||
www.ppac.gov.in jeena scriptech research
It’s not any rocket science to conclude the double whammy India is facing on Oil prices surging and the Rupee spiking. Both will increase our Oil Import Bill significantly .Our current Oil Basket is already at US $ 117 /barrel quotation this morning with the Rupee weakening past Rs 77/US $ 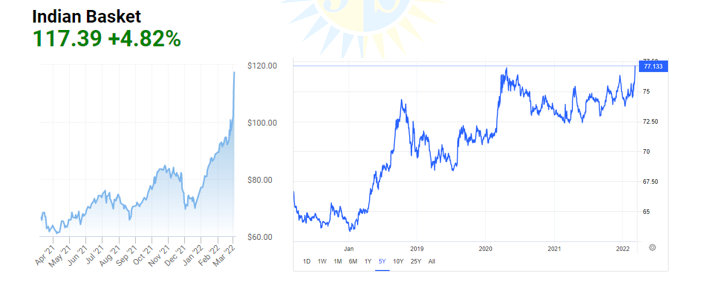
- Record Outflows by Foreign Portfolio Investors (FPIs)
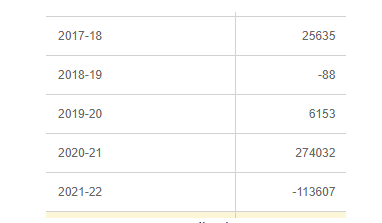
In the past five months ,FPIs have been exiting Indian Equities almost daily and have pulled out Rs 122137 crs ,just under US $ 16 Billion in this period till March 4,2022 .In FY 22 thus far the net vacuuming has been Rs 113607 crs or just under US $ 15 Billion. This outflow has followed a record inflow of Rs 274032 crs or US $ 35.5 Billion in FY 21
FPI Flows in 2021 and 2022 till date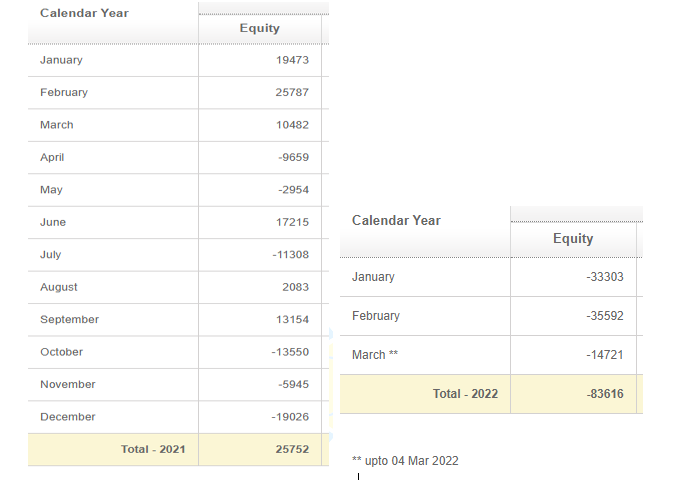
www.nsdl.co.in
One may query as to why then had the Sensex not corrected even more sharply earlier on such outflows. The answer probably lies in the unique doubling of registered Indian Investors in two years from a base of 40 million to 99 million as of date as extracted from www.bseindia.com . Making allowance for multiple demat accounts ,the investor base would yet be over 60 million with most of the incremental in the age group of 25 to 35.They had neither seen a Bear Market before nor were overawed by veterans reputation and experience .They have demonstrated a lot of aggression and high risk taking akin to even gambling at times in lure of instant gratification and mistaking luck for skills with Valuation taking a back seat . They along with Indian Institutions absorbed the selling.
With US Yields slated to rise and with Indian Markets running ahead of fundamentals and peaking in October 2021 and given the tightening of the risk-reward scenario with consideration of rupee drifting further south of the dollar that FPIs have been moving out from Indian Equity. Our Foreign Exchange Reserves too have reflected this outflow by dropping from US $ 640 + Billion to US $ 630+ Billion. Continuing FPI Outflows and a rising Oil Import Bill should see a further drop in Fx Reserves.
It is on the cards that the much-awaited LIC IPO will be deferred into FY 23.Given this sentiment , the earlier timing for this month would now be ill advisable . The Revised Disinvestment Target of Rs 78000 crs for FY 22 will also not thus be met ,creating a further deficit and therefore debt in the revised budget estimates for FY 22
What about those who initiated Equity Investments in 2021,especially in the Small Cap and Mid Cap Segments and are seeing concerning erosion in such holdings inside a year ?
If the Holdings are fundamentally sound selections, the share prices will bounce back and give gains in the longer term which should have been the mindset when investing in them. Should one be averaging then in them if Cash, Courage and Conviction is there ? Not necessarily as weightage of selections in the existing portfolio should be a consideration as also availing newer value opportunities that always rise on such corrections
What about Core Holdings ?
Core Holdings tend to mirror the Sensex and Nifty and returns could thus well be like those from passive index investing unless the Core Selection outperforms the Index .Core Holdings also serve to protect Capital while growing it more comfortably than Non-Core Holdings as they demonstrate a lower ‘Beta’ ,Beta being a factor of Volatility.
Based on your Risk Profile we advocate an appropriate Core Weightage within your Equity Allocation and highly recommend Direct Core Equity rather than Investment in Core Equity Exposure through Active or Passive Index Mutual Fund Schemes to give you the potential to earn a much higher CAGR
Let’s take a five-year early March 2017 to March 7, 2022 period and TCS as an illustration.
TCS was available at Rs 2500 in early March 2017 and closed today at Rs 3485.In this Five-Year Period it declared a 1:1 Bonus in May 2018. A Rs 2.5 lakhs investment in 100 TCS Shares in March 2017 would be 200 shares now worth @ Rs 7 lakhs . This translates into a 23% CAGR in Five Years not considering the liberal Dividends it gave as well as the advantage of four buybacks in this period in May 2017,August 2018,November 2020 and currently March 2022.
Passive Sensex Investing would have returned 12.9% CAGR in the same Five-Year period with the Sensex moving up from 28800 levels in early March 2017 to 52843 today
Let’s summarize this :
| Investment in | Five Year CAGR % |
| TCS | 23 |
| Sensex Index Fund of any Mutual House | 12.9 |
A Last Word….Two years ago our March 15,2020 Scrip Standpoint released with the March 13,2020 Sensex level at 34103 as the Pandemic was setting in was titled
2020 GLOBAL STOCKS MELTDOWN ~ AN OPPORTUNITY ?
Cash Courage Conviction
The Sensex further collapsed to the pandemic fearful low of 25639 within days on March 24,2020. The remarkable recovery from there is now folklore .
Going forward the four shaken legs of the Equity Table ~ Valuation, Liquidity, Sentiment and Momentum ~ may stumble some more ~ but look at it this way : Value Vs Price Assessment will become that much more convincing
Over-riding Advice is never to stray from the discipline of Asset Allocation to enjoy Investing and protect your wealth while growing it. In your Equity Selections may you have the fortitude to be invested early in brilliant compounders and the wisdom to stay invested in them regardless of any drawdowns in them in periods of nervousness and uncertainty
Do stay in Cheer,
Gaurav Parikh, Managing Director, [email protected] +91-9820162597
Disclosure & Disclaimer
Jeena Scriptech Alpha Advisors Pvt Ltd (JSAAPL) is a SEBI Registered Entity offering Fundamental Direct Equity Research Analysis, Equity Portfolio Advisory, Training & Mentoring Services in Capital Markets
This Report is under our free access SCRIP STANDPOINT Module.It is for the personal information of the recipient/reader. We are not soliciting any action based upon it. This report is not to be construed as an offer to sell or the solicitation of an offer to buy any security in any jurisdiction. It is our Viewpoint for general information purposes only. It does not take into account the particular investment objectives, financial situations, or needs of individuals & other entities .We have reviewed the report, and in so far as it includes current or historical information, it is believed to be reliable though its accuracy or completeness cannot be guaranteed. Neither JSAAPL, nor any person connected with it, accepts any liability arising from the use of this document. The recipients of this material should rely on their own investigations and take their own professional advice. Opinions expressed are our current opinions as of the date appearing on this material only. No part of this material may be duplicated in any form and/or redistributed without JSAAPL’s prior written consent. In case you require any clarification or have any concern, kindly write to us at: [email protected]