India Cements Ltd
Cements & Cement Products
FV – Rs 10; 52wks H/L – 140/67.9; TTQ – 2.60 Lacs; C MP – Rs 118 (As On July 24, 2020);
Market Cap – Rs 3668 Crs
Consolidated Financials and Valuations (Amt in Rs Crs unless specified)
| India Cement | ||||||||||
| Year | Equity Capital | Net Worth | Debt | Total Sales | PAT | BV | EPS | P/E | P/BV | Promoter’s Holdings |
| Rs Cr. | Rs Cr. | Rs Cr. | Rs Cr. | Rs Cr. | Rs | Rs | % | |||
|
FY20 |
310 | 5498 | 3163 | 5228 | 53 | 177 | 1.71 | 69 | 0.67 | 28.27 |
| FY19 | 310 | 5246 | 3048 | 5809 | 25 | 169 | 0.82 | 161.57 | 0.78 | 28.30 |
India Cements Ltd asserted that the management in the company was stable and it would continue its focus on cement business. (https://www.thehindubusinessline.com/companies/india-cements-posts-loss-in-q4-full-year-on-covid-19-impact/article31904718.ece#)
Overview:
- The India Cements Ltd. is a pioneer enterprise during the post-independence era to become a public limited company.
- From a two plant company having a capacity of just 1.3 million tonnes in 1989, India Cements has robustly grown in the last two decades to a total capacity of 15.5 million tonnes per annum.
- After the approval of a Scheme of Amalgamation and arrangement between Trinetra Cement Ltd and Trishul Concrete Products Ltd with The India Cements Ltd, all the cement assets have come under one roof – India Cements. India Cements has now 8 integrated cement plants in Tamil Nadu, Telangana, Andhra Pradesh and Rajasthan and two grinding units, one each in Tamil Nadu and Maharashtra.
- The company has 13 subsidiaries controlled through shareholdings in such Companies, none of which is material.
The performance of the Company was also in line with the improved performance of the industry with increase in clinker production, cement production and sales which are as under:
| Particulars | 2019 | 2018 | % Growth |
| (In Lakh Tonnes) | |||
| Clinker Production | 91.59 | 80.09 | 14 |
| Cement Production | 123.11 | 111.15 | 11 |
| Cement Sales | 122.83 | 111.5 | 10 |
| Clinker Sales | 1.57 | 0.26 | 504 |
| Total Sales | 124.4 | 111.76 | 11 |
Mr. N. Srinivasan is the Vice Chairman & MD of the company.
Shareholding Pattern:

Major Holdings:
| Non – Promoters | No. of shares held | % shares held |
| Subdaram Mutual Fund | 7188453 | 2.32 |
| ELM Park Fund Ltd | 17361746 | 5.6 |
| LIC | 14576741 | 4.71 |
| Radhakishan S Damani | 33452777 | 10.8 |
| Gopikishan S Damani | 25601589 | 8.26 |
| Radhakishan S Damani & Gopikishan S Damani | 4145103 | 1.34 |
| Sri Saradha Logistics Pvt. Ltd | 20621843 | 6.66 |
Share Price Trend:

Price Snapshot:
| Year | Open (Rs.) | High (Rs.) | Low (Rs.) | Close (Rs.) |
| 2010 | 124.5 | 143.15 | 95 | 107.65 |
| 2011 | 107.25 | 112.8 | 62.1 | 65.95 |
| 2012 | 66.1 | 118.5 | 65.05 | 90.75 |
| 2013 | 91.3 | 95 | 43 | 60.1 |
| 2014 | 59.8 | 134.3 | 46 | 85.4 |
| 2015 | 86.5 | 115.8 | 63.6 | 85.4 |
| 2016 | 97.55 | 164 | 64 | 116.65 |
| 2017 | 117.4 | 226 | 117.4 | 182.6 |
| 2018 | 184.6 | 205.9 | 80.05 | 96.1 |
| 2019 | 96.2 | 116.9 | 67.9 | 71.4 |
| 2020 | 71.25 | 140 | 69.55 | 119.95 |
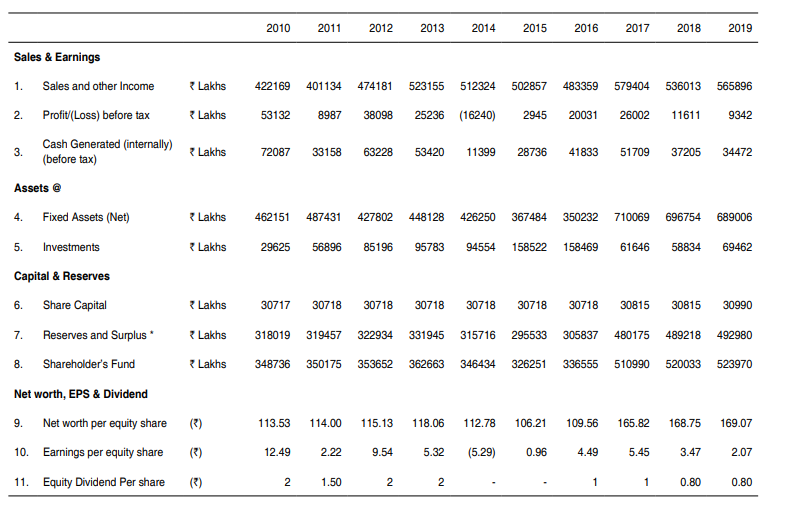
Financials:

The sales volume increased by 10% during the year while the gross realisation per ton of cement was lower on account of lower selling price resulting in only a marginal improvement in the top line.
Peer Comparison:
| India Cement | Ultratech Cements | Shree Cements | Birla Corporation | |
| Price (Rs) | 118 | 3779 | 21343 | 560 |
| FV (Rs) | 10 | 10 | 10 | 10 |
| Market Cap | 4081 | 109093 | 77007 | 4312 |
| Equity | 310 | 289 | 36 | 77 |
| Net Worth | 5498 | 39115 | 13169 | 4806 |
| Total Debt | 3163 | 21353 | 2349 | 3753 |
| Sales | 5228 | 42773 | 13143 | 7001 |
| Net Profit | 53 | 5810 | 1544 | 505 |
| EPS (Rs) | 1.71 | 201.3 | 428 | 65.6 |
| BV (Rs) | 177 | 1355 | 3650 | 624 |
| PE | 69 | 18.8 | 49.8 | 8.5 |
| PB | 0.67 | 2.8 | 5.8 | 0.9 |
| Capacity (MT) | 15.5 | 111.4 | 40.4 | 15.5 |
| Realization Per Tonne | 3650 | 4750 | 4648 | 4712 |
