Details on the Investment:
Murugappa Group’s engineering firm Tube Investments picked up a controlling stake in CG Power & Industrial Solutions for Rs 700 crore.
CG Power has approved a proposal to issue shares and warrants on a preferential basis.
On 2nd September 2020, Tube Investments upped their investment by Rs 100 crs in the form 68.73 million equity shares of CG Power to be issued to TII at Rs 14.55 per equity share on a preferential basis. This will increase its stake to 58.58%
Key Financial Data:
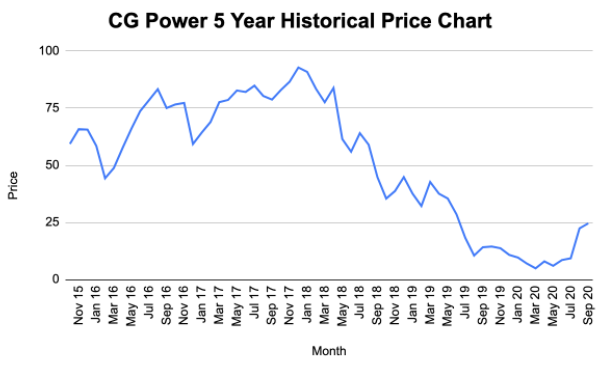
52 W H/L: 25/4.6
Market Cap: Rs 1558 crs
| FV | CMP | Equity Capital | Networth | Total Debt | Total Income | PAT | EPS | BV | |
| FY 20 | 2 | 25 | 125 | -104 | 1661 | 5158 | -2167 | -34 | -2 |
| FY 19 | 125 | 2185 | 2729 | 8049 | -507 | -8 | 35 |
CG Power is engaged in engineering solutions and the power sector and has 13 manufacturing facilities.
The main reasons for losses in CG ower other than the loss from the Power Segment (Rs 222.3 crs) are due to Exceptional Items (Rs 1788 crs) mainly A provision for a doubtful advancement for Rs 905 crs. A (provision) of net assets of subsidiaries for Rs 468 crs and a Liability on deconsolidation of HBE Group of Rs 341 crs.
Brief History on the Fraud at CG Power:
In August 2019, CG Power had reported a financial scam found in an investigation by an independent law firm where some employees had carried out unauthorised transactions, which led to an understatement of the liabilities of CG Power and advances to related and unrelated parties of the company and the group. The company said that total liabilities may have been potentially understated by Rs 1,053.54 crore for CG Power and Rs 1,608.17 crore for the whole group.
As a result, the chairman of the group Mr Gautam Thapar was fired.
Historical Price Chart: