UNION BUDGET 2020
S(LAYING) THE ECONOMIC FOUNDATION
Disconnect | Deficit | Debt | Disinvestment | Dividend | Dispute
deduce ~ reach a conclusion by thinking about the information or evidence that is available
deconstruct ~ reduce something to it’s basic elements in order to interpret it in a different way
Here’s the flow of how we have deconstructed and deduced the Union Budget 2020 for you with a focus on the ‘D’s as above offering you a perspective on each supported by government statistics on record .This a Three Part Scrip Standpoint , each of which is being send separately to reinforce the content.This is PART II on Deficit and Debt
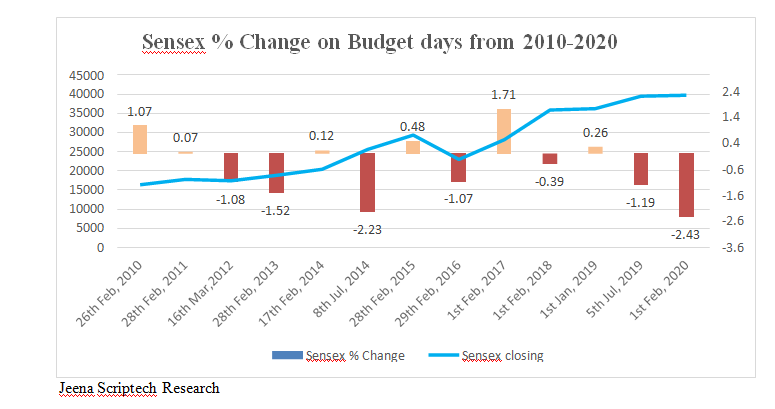
PART I ~ DISCONNECT ~Declining Economic Growth vs Rising Record Sensex
PART II ~ DEFICIT AND DEBT ~ Dancing with Deficit and are Sovereign Bonds the Solution?
PART III ~ DISINVESTMENT ~ (Dis)Comfort with Complacency of a High LIC Valuation
DIVIDEND DISTRIBUTION TAX ~ Reverting to taxing the Recipient
DISPUTE ~ Vivad se Vishwas Scheme ~ One Time Offer for resolving Direct Tax Disputes
PART II
DEFICIT and DEBT
DANCING WITH DEFICIT
|
2018-2019 |
Interim 1
2019-2020 |
Interim 2
2019-2020 |
2019-2020 |
2020-2021 |
|
Actual |
Budget Estimate |
Budget Estimate |
Revised Estimate |
Budget Estimate |
| Budget Date |
1/2/2018 |
1/2/2019 |
5/7/2019 |
1/2/2020 |
1/2/2020 |
| GDP (Rs Crs) |
1,90,10,000 |
2,11,00,607 |
2,10,07,439 |
2,04,42,233 |
2,24,89,420 |
| Nominal GDP Growth Rate % |
13.3 |
12.0 |
10.5 |
7.5 |
10 |
| Fiscal Deficit (Rs Crs) |
6,49,418 |
7,03,760 |
7,03,999 |
7,66,846 |
7,96,337 |
| Deficit / GDP % |
3.4 |
3.3 |
3.4 |
3.8 |
3.5 |
Source : Budget Documents
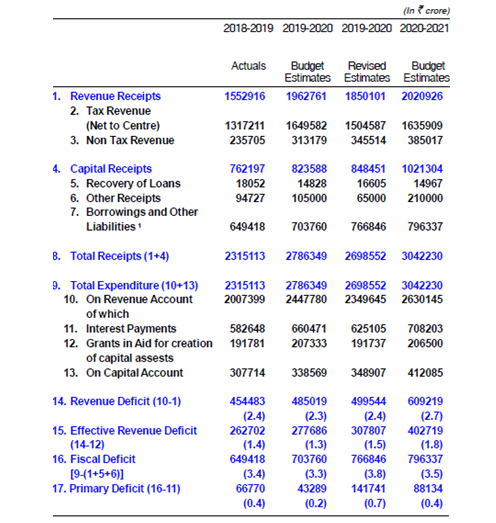
The Fiscal Deficit is shown at 3.8% of GDP in FY 20 and marginally lower at 3.5% for FY 21. The Fiscal Deficit in FY 20 from an initial targeted Rs 7,03,760 crs has now been increased by a net Rs 63,086 crs to Rs 7,66,846 crs
The Finance Minister, Mrs Nirmala Sitharaman by keeping this ratio at 3.8% has :
- invoked the escape clause in the Fiscal Responsibility and Budget Management Act (FRBM) that allows a maximum upward deviation of 0.5 %
- addressed the risk of potential sovereign debt downgrade given the plan to increase Sovereign Debt
The Reality is that there is a huge Deficit in disclosing the real Fiscal Deficit. As the table below shows ,just the shortfall in both Corporate Tax and Disinvestment Receipts would have taken the Fiscal Deficit to 4.4% of GDP.The actual Fiscal Deficit is actually significantly much more than even this on account of off budget financing sources that the government has resorted to.
| In Rs Crs |
Initial FY 20 |
Revised FY 20 |
Differential |
Adjusted FY 20 |
| GDP |
2,11,00,607 |
2,04,42,233 |
6,58,374 |
2,04,42,233 |
| Corporate Tax Receipts |
7,66,000 |
6,10,500 |
1,55,500 |
|
| Disinvestment Receipts |
1,05,000 |
65,000 |
40,000 |
|
| Fiscal Deficit |
7,03,760 |
7,66,846 |
63,086 |
8,99,260 |
| Fiscal Deficit /GDP |
3.3 |
3.8 |
|
4.4 |
So how has the Government been able to keep the Fiscal Deficit at 3.8% of the GDP ?
We are not questioning the sanctity of the revised Total Tax Revenues Estimates for ongoing FY 20 even though there is growing concern that the government is optimistic on these and that there will be shortfall in the collection .One of the reasons we are not doubting these is the new ‘one time’ Settlement opportunity for disputed Direct Taxes being offered through a new ‘Vivad se Viswas’ Scheme that the government has announced in this Budget.More on this in Part III in a separate note that will follow
So we look at the Expenditure Side
Government clearly has benefited in a lower Interest Outgo than originally budgeted for ,in part due to falling interest rates.Interest Outgo is significantly reduced by Rs 35366 crs
| In Rs Crs |
Original FY 20 Estimates |
Revised FY 20 Estimates |
Differential Benefit |
| Interest Payments |
6,60,471 |
6,25,105 |
35,366 |
Then in clearly what appears to be a deliberate balancing act to reduce the Fiscal Deficit, the Government has slashed the expenditure on Central Sector Schemes and Projects chiefly on Food Subsidies
| In Rs Crs |
Original FY 20 Estimates |
Revised FY 20 Estimates |
Differential Benefit |
| Central Sector Schemes/ Projects |
8,70,794 |
7,73,196 |
97,598 |
Of Which
| In Rs Crs |
Original FY 20 Estimates |
Revised FY 20 Estimates |
Differential Benefit |
| Food Subsidies |
1,84,220 |
1,08,688 |
75,532 |
Thus the Budget Balancing Fiscal Deficit Maths becomes clearer
|
|
Rs in Crs |
| A |
Shortfall in Receipts |
|
|
Corporate Tax |
1,55,000 |
|
Disinvestment |
40,000 |
| |
|
1,95,000 |
| B |
Slashing of Expenditure |
|
|
Interest Payments |
35,366 |
|
Central Sector Schemes/Projects |
97,598 |
| |
|
1,32,964 |
| A–B |
Increase in Fiscal Deficit |
62,036 |
| |
Actual Fiscal Deficit Differential as shown in a Table on Page 2 |
63,086 |
Two thoughts cross our mind on this Dancing with the Deficit to balance the Budget to keep it at 3.8% of GDP
- A Former Finance Minister ,Mr P Chidambaram ,in the UPA government had done a similar slashing of Expenditure in his FY 13 Union Budget just to show the Fiscal Deficit at lower than it actually should be.Yet it was as high as 5.2% of the GDP. He knocked off a whopping Rs 92,000 crs by reducing Plan Expenditure Estimates from the original estimates of Rs 5,21,000 crs to a revised Rs 4,29,000 crs! This begs a question that most Government Plans and Projects are never really fully expended or else there would be no huge cushion for such cuts !
- What was the need to reward the Corporate Sector on September 19,2019 when our FM Minister, Mrs Nirmala Sitharaman announced, what should be seen as a forced measure, a Tax Bonanza for Corporates busting the Tax Rate from an effective high of 34.94% for most to an effective 25.168% .Government Sacrifice is Rs 1,45,000 crs or US $ 20 Billion in Corporate Tax Revenues .It’s like the Government conceding to the Corporate Sector ” Hey Guys ! we’re transferring our Revenues to you as you’ll can put it to more productive use by funding an Investment Capex Cycle to stimulate more growth for better returns than we can through increased Government Spending ” .Our September 24,2019 Scrip Standpoint was on this and in our opinion this was a forced measure simply to boost stock markets
Given the current economic scenario of the country and it’s near stagflation condition where Demand appears to decline or stay stagnant despite rising inflation and monetary or fiscal growth stimulus measures that have been announced (Repeated Repo Rate Cuts have not transmitted into higher credit offtake) the government was in no position to announce such a Corporate Tax Rate Cut even though this was a committed plan from 2014 when NDA came into power at the Centre.It should have been deferred to a few years down the road once Economy revives on a higher Growth track.Remember this will be an annual sacrifice of Corporate Tax Revenues with a hope that in due course Tax Buoyancy will result to compensate
Rajiv Kumar of Niti Aayog had opined in September 2019 that the Government will make up this loss of Corporate Tax Revenues through higher Non-Tax Revenues in FY 20..He clearly was referring to Disinvestment and RBI Transfers to the Government .Though the Disinvestment Target of Rs 1,05,000 crs in FY 20 has been revised down to Rs 65,000 crs the target for FY 21 has been raised to the highest ever at Rs 2,10,000 crs. Look out for our Part III in a separate note for more on Disinvestment.There has been an unprecedented transfer of Rs 1,76,051 crs or US $ 25 Billion that RBI was induced to make to the Government post Budget in August 2019 of which a portion is out of RBI Reserves of earlier years & which has not been considered in the Budget Exercise. The transfer includes Rs 1,23,414 crs of surplus for 2018-19 and Rs 52,637 crore of excess provisions identified as per the revised economic capital framework.
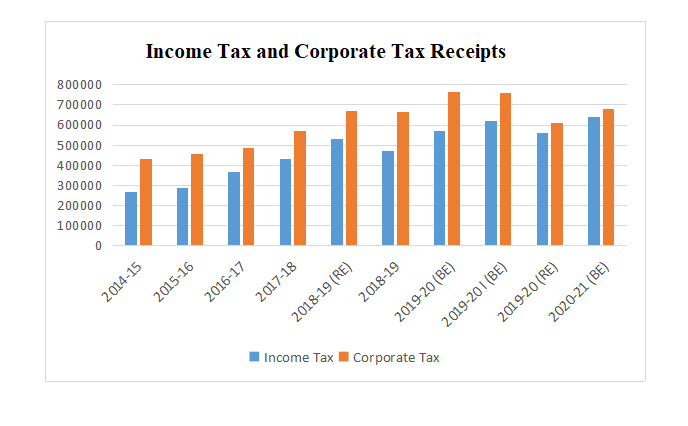
Here’s the Trend of Direct Tax Revenues from FY 15 when the NDA first came to power under Prime Minister Mr Narendra Modi. Clearly this second NDA Term shows the path forward where Income Tax and Corporate Tax Revenues are converging, singularly due to this huge Corporate Tax Rate cut announced in September 2019
In Rs Crs
| Year |
2014-15 |
2015-16 |
2016-17 |
2017-18 |
2018-19 (RE) |
2018-19 |
2019-20 (BE) |
2019-20 I (BE) |
2019-20
(RE) |
2020-21
(BE) |
| Income Tax |
2,65,733 |
2,87,637 |
3,64,604 |
4,30,772 |
5,29,000 |
4,73,003 |
5,69,000 |
6,20,000 |
5,59,500 |
6,38,000 |
| Corporate Tax |
4,28,925 |
4,53,228 |
4,84,924 |
5,71,202 |
6,71,000 |
6,63,572 |
7,66,000 |
7,60,000 |
6,10,500 |
6,81,000 |
DEBT ~ ARE SOVEREIGN BONDS THE SOLUTION?
Here’s the Total Government Outstanding Debt Estimates
|
March 31,2020 |
March 31,2021 |
|
Rs Crs |
US $ Billion |
Rs Crs |
US $ Billion |
| Internal Debt and Other Liabilities |
97,25,254 |
1360 |
106,36,984 |
1488 |
| External Debt |
2,92,867 |
41 |
3,13,036 |
44 |
| Total |
100,18,121 |
1401 |
109,50,020 |
1532 |
Source : Budget Documents
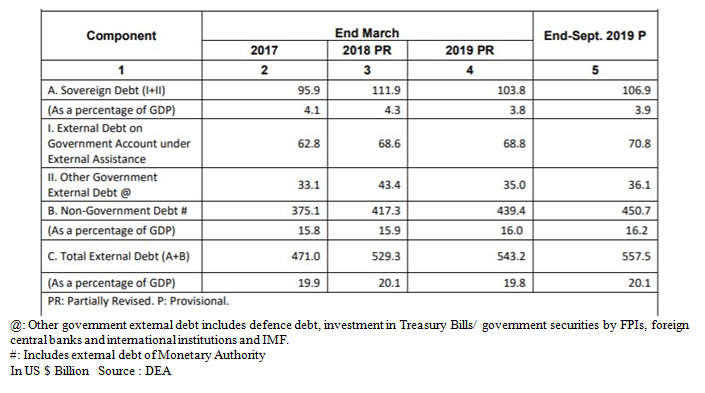
Here’s the Total Government and Non Government External Debt as on September 30,2019
Here’s the External Debt to GDP and FX Reserves to External Debt
| As on March 31 |
External Debt |
External Debt to GDP |
FX Reserves to External Debt |
Forex Reserves |
|
US $ Billion |
% |
% |
US $ Billion |
| 2014 |
446.2 |
23.9 |
68.2 |
304 |
| 2015 |
474.7 |
23.8 |
72 |
342 |
| 2016 |
484.8 |
23.4 |
74.3 |
360 |
| 2017 |
471 |
19.9 |
78.5 |
370 |
| 2018 |
529.3* |
20.1 |
80.2 |
425 |
| 2019 |
543.2* |
19.8 |
76 |
413 |
| As on Sept 30,2019 |
557.5# |
20.1 |
77.8 |
434 |
| As on January 31,2020 |
570 ^ |
19.9 & |
82.6 |
471 |
| * Partially Revised |
# Provisional |
^ Assumed |
& on lower revised budget GDP estimates |
|
| Source : DEA,RBI |
|
|
|
|
Are Sovereign Bonds the Solution ?
The US $ 106.9 Billion Sovereign Bonds External Debt as on September 30,2019 is :
- 7 % of revised estimates of FY 20 GDP of US $ 2.86 Trillion at current Exchange rate @ US $ = Rs 71.50
- 6% of Total Government Outstanding Debt estimates of US $ 1401 Billion for FY 20 excluding the US $ 70. 8 Billion shown as Govt external debt under external assistance
- 75 % of assumed Total Government and Non Government External Debt of US $ 570 Billion end FY 20
Current Government thinking, advocated even by it’s Chief Economic Advisor (CEA), K Subramanian,is to increase the Sovereign Borrowing for funding Infrastructure given that currently the Sovereign Debt is at under 5 % of GDP
The Union Budget 2020 has announced incentives to attract Sovereign Wealth Fund Investments with a minimum lock in for three years by offering 100% Tax Exemptions for Interest, Dividends and Capital Gains for such Investments if made in Infrastructure and notified sectors before March 31,2024
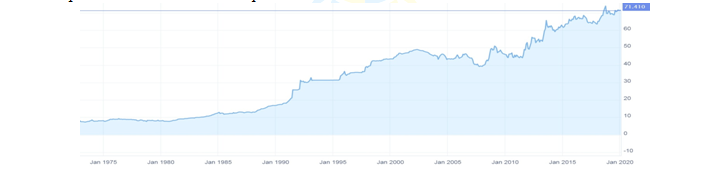
In 2019 the CEA had expressed his view that India would be at an advantage in future repayments of such Sovereign Debt in foreign currencies as in his view the Rupee would appreciate thus creating a lower liability on both principal and interest.
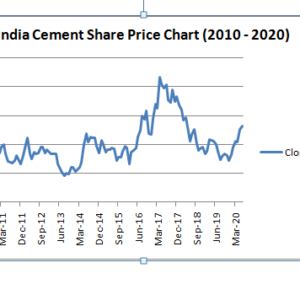
History of the Indian Rupee does not support this optimism and there is a clear Exchange Rate Risk as can be observed from this trend from past near fifty years (refer to graph below) and the reality of existing stress in Exports & Manufacturing .If Global Tensions heighten then there would be Turm-Oil and further pressure on the Rupee on increasing Crude Prices as India continues to be an oil intensive nation that imports over 70% of it’s Oil requirements
We see very clear Present and Future Danger in this dependence and reliance on funds from overseas to fund India’s Growth :
- Currency risk that will increase our sovereign debt liability on a depreciating rupee
- An increasing foreign ownership of Indian Assets and Business
We need to aggressively tap domestic funding to reduce this external debt dependence. The Government has had limited success in monetizing private Gold in India and in Private Public Partnerships. It’s falling back on Disinvestment and Privatisation as a source of Funds raises more questions than it answers as explained in Part III in a separate note to follow. Fresh Independent Effective Thinking without Bias, Fear or Favour is the need of the hour on the way forward to put India back on a sustainable high growth track .
Disclosure & Disclaimer
Jeena Scriptech Alpha Advisors Pvt Ltd (JSAAPL )is a SEBI Registered Entity offering Fundamental Direct Equity Research Analysis, Equity Portfolio Advisory, Training & Mentoring Services in Capital Markets
This Report is under our free access SCRIP STANDPOINT Module.It is for the personal information of the recipient/reader. We are not soliciting any action based upon it. This report is not to be construed as an offer to sell or the solicitation of an offer to buy any security in any jurisdiction. It is our Viewpoint for general information purposes only. It does not take into account the particular investment objectives, financial situations, or needs of individuals & other entities .We have reviewed the report, and in so far as it includes current or historical information, it is believed to be reliable though its accuracy or completeness cannot be guaranteed. Neither JSAAPL, nor any person connected with it, accepts any liability arising from the use of this document. The recipients of this material should rely on their own investigations and take their own professional advice. Opinions expressed are our current opinions as of the date appearing on this material only. No part of this material may be duplicated in any form and/or redistributed without JSAAPL’s prior written consent.
In case you require any clarification or have any concern, kindly write to us at : [email protected]