Vikas Ecotech Ltd
Speciality Chemicals
FV – Rs 1; 52wks H/L – 10.55/0.96; TTQ – 13.47 Lacs; CMP – Rs 10.5 (As On August 13, 2020);
Market Cap – Rs 295 Crs
Standalone Financials and Valuations (Amt in Rs Crs unless specified)
Equity Capital |
Net worth |
Debt | Total Sales |
PAT | BV (Rs) |
EPS (Rs) |
P/E |
Industry P/E |
P/BV |
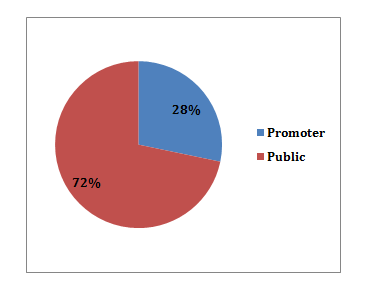
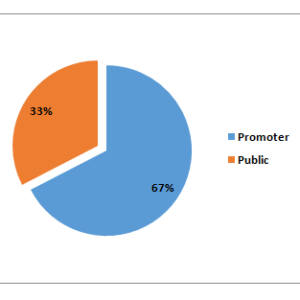
Promoter’s Stake |
|
| FY20 | 28 | 143 | 144 | 199 | 1 | 5 | 0.04 | 262 | 19.4 | 2 | 32.51 |
| Q1 FY21 | 28 | 140 | 144 | 8 | -5 | 5 | -0.2 | – | 19.4 | 2 | 32.51 |
- The demerger of ‘Recycled and Trading Compounds Division’ of the Company was successfully completed during the year under review and the Shareholders of the Company were allotted shares in ratio of 1:1 of Vikas Multicorp Ltd.
- The Company completed commercial scale production trials and the added capacity of Specialty Chemicals plant at Rajasthan is ready for utilization in anticipation of enhanced production and sales for the next fiscal year as well.
- The Company successfully designed & tried the new range of Eco-friendly Calcium Zinc Heat Stabilizer for PVC across various application areas like the PVC Rigid & Soft PVC Applications which have been included in the list with this new addition to the product mix offered by VEL. VEL is ready to start commercial scale production in anticipation of the huge demand that will be created with the implementation of the ban on Toxic Stabilizers.
- As anticipated, targeted & projected for the FDA approved – Food Contact Safe Organotin Stabilizers, for which Vikas Ecotech is the only producer in India and one of the very few across the globe, the Company has successfully initiated the process for tapping the potential embedded in the largest market place for the Organotin Stabilizers the U.S.A. & has been received well by the market due to its consistent quality of the materials.
Overview:
- Vikas Ecotech is an emerging player in the global arena of the high end specialty chemicals players.
- They cater to products ranging from agriculture to automotives, cables to electricals, hygiene to healthcare, polymers to packaging, textiles to footwear as per industry needs.
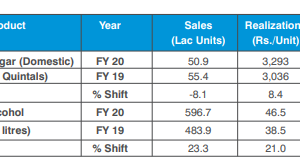
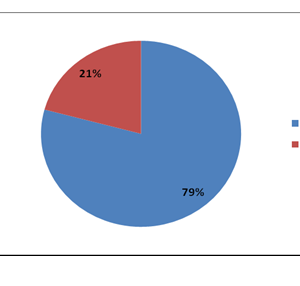
- The Company operates under single segment which is manufacturing and trading of speciality additives including agrochemicals and rubber-plastic and polymer compounds. Product wise performance of the Company is discussed here under :
- Speciality Additives – The Company is a leading manufacturer of specialty additives as we derive our competitive edge from our innovative products with real-world applications. There are 5 products in this range.
Organotin or Methyl Tin Mercaptide (MTM) continues to be the focus of the company’s specialty additives segment and they are India’s only indigenous manufacturer of organotin among the eight global manufacturers of the additive. USA is the world’s largest consumer of this product.
- Polymer Compounds – The Company is also a leading manufacturer of specialty rubber-plastic and polymer compounds. They have 3 products in this category.
Management:
- Gyan Prakash Govil – Chairman
- Vikas Garg – MD
- Amit Dhuria – CFO
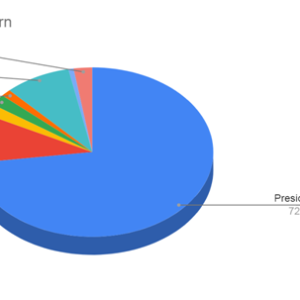
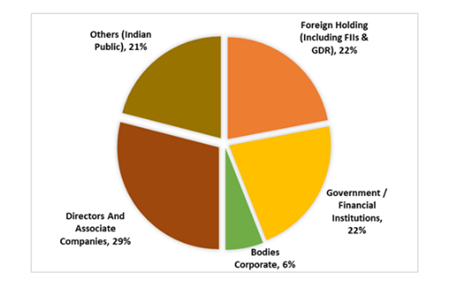
Shareholding Pattern: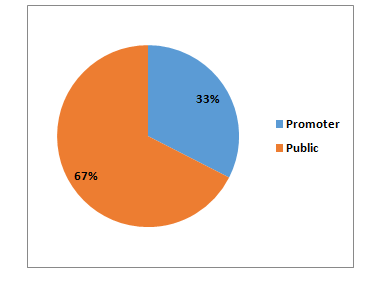
Major Holdings:
| Non – Promoters | No. of shares held | % shares held |
| Elara India Opportunities Fund | 9502125 | 1.43 |
| Nomura Singapore Ltd | 19328292 | 2.91 |
| Parvesh Sahib Singh | 11000000 | 1.66 |
| Ram Niwas Mangla | 9000000 | 1.36 |
| Siddhayu Ayurvedic Research Foundation Pvt. Ltd | 7294990 | 1.1 |
| Jayant S Ciahheda HUF | 19822000 | 2.99 |
| Jainet rading LLP | 10345255 | 1.56 |
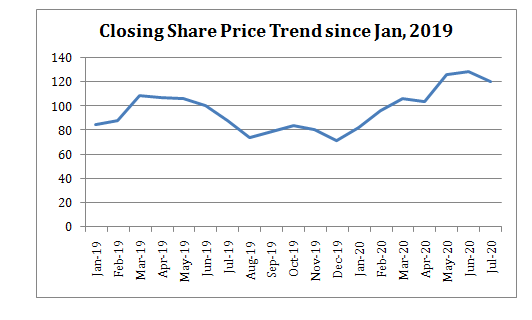
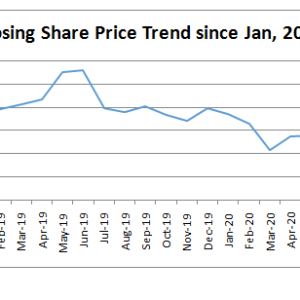
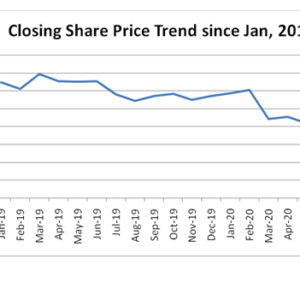
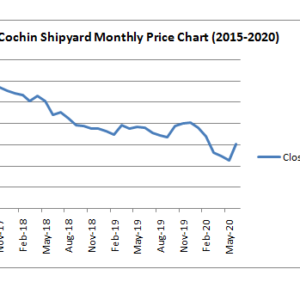
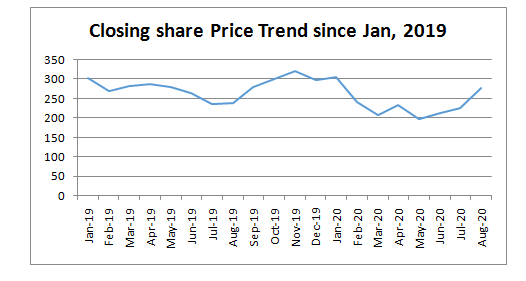
Share Price Trend:
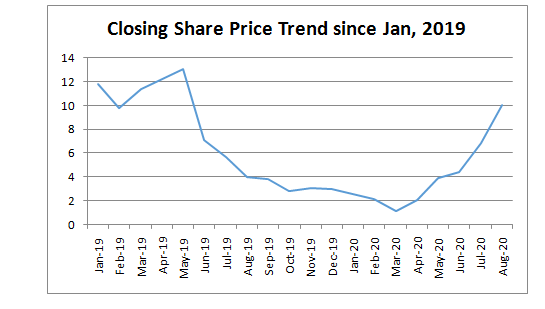
Share Price Snapshot :
| Year | Open (Rs.) | High (Rs.) | Low (Rs.) | Close (Rs.) |
| 2016 | 20.35 | 22.9 | 10.85 | 16.5 |
| 2017 | 16.55 | 38.15 | 15.85 | 35.7 |
| 2018 | 35.5 | 48.5 | 10.42 | 11.93 |
| 2019 | 11.83 | 16.17 | 2.54 | 2.99 |
| 2020 | 2.99 | 10.05 | 0.96 | 10.05 |
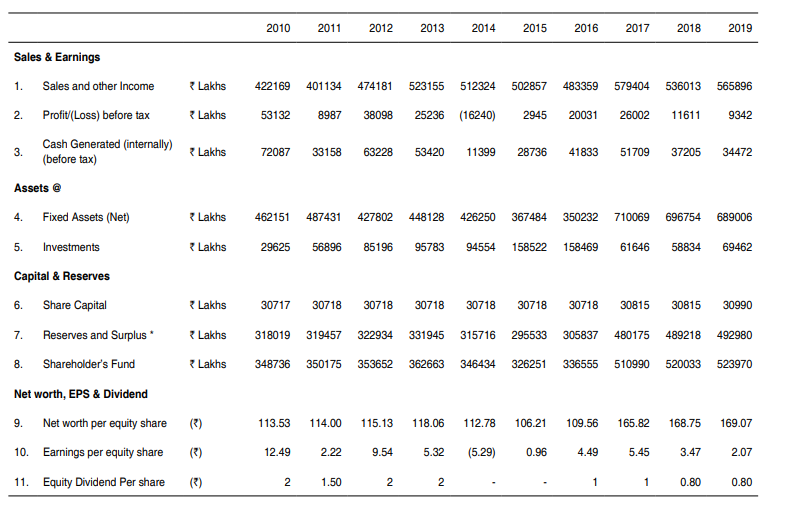
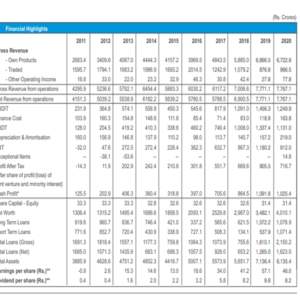
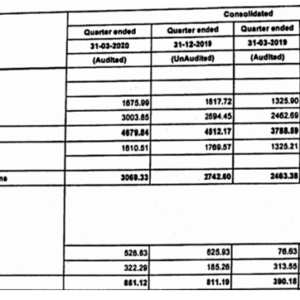
Standalone Financials: (Rs. Crs unless specified)
| Particulars | 2020 | 2019 | 2018 | 2017 | 2016 |
| Sales | 199 | 270 | 240 | 373 | 312 |
| Net Profit | 1 | 16 | 27 | 23 | 26 |
| EPS (Rs.) | 0.04 | 0.57 | 0.96 | 0.82 | 1.04 |
| Share Capital | 28 | 28 | 28 | 28 | 25 |
| Networth | 143 | 143 | 128 | 131 | 66 |
| Book Value (Rs.) | 5 | 5 | 5 | 5 | 3 |
| Debt | 144 | 155 | 138 | 108 | 91 |
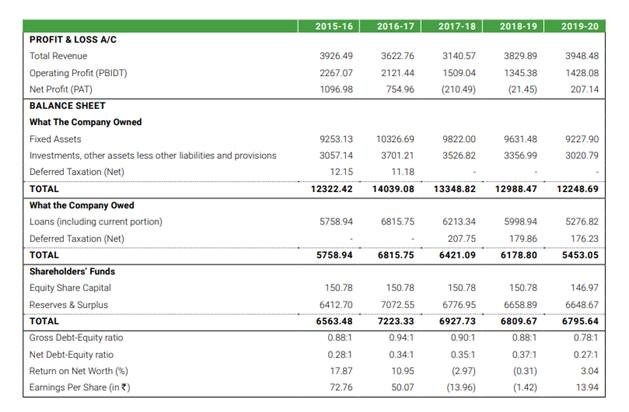
 Source : Company Results